RocCurveDisplay#
- class sklearn.metrics.RocCurveDisplay(*, fpr, tpr, roc_auc=None, name=None, pos_label=None)[source]#
ROC Curve visualization.
It is recommended to use
from_estimatororfrom_predictionsorfrom_cv_resultsto create aRocCurveDisplay. All parameters are stored as attributes.For general information regarding
scikit-learnvisualization tools, see the Visualization Guide. For guidance on interpreting these plots, refer to the Model Evaluation Guide.- Parameters:
- fprndarray or list of ndarrays
False positive rates. Each ndarray should contain values for a single curve. If plotting multiple curves, list should be of same length as
tpr.Changed in version 1.7: Now accepts a list for plotting multiple curves.
- tprndarray or list of ndarrays
True positive rates. Each ndarray should contain values for a single curve. If plotting multiple curves, list should be of same length as
fpr.Changed in version 1.7: Now accepts a list for plotting multiple curves.
- roc_aucfloat or list of floats, default=None
Area under ROC curve, used for labeling each curve in the legend. If plotting multiple curves, should be a list of the same length as
fprandtpr. IfNone, ROC AUC scores are not shown in the legend.Changed in version 1.7: Now accepts a list for plotting multiple curves.
- namestr or list of str, default=None
Name for labeling legend entries. The number of legend entries is determined by the
curve_kwargspassed toplot, and is not affected byname.If a string is provided, it will be used to either label the single legend entry or if there are multiple legend entries, label each individual curve with the same name.
If a list is provided, it will be used to label each curve individually. Passing a list will raise an error if
curve_kwargsis not a list to avoid labeling individual curves that have the same appearance.If
None, no name is shown in the legend.Changed in version 1.7:
estimator_namewas deprecated in favor ofnameand now accepts a list for plotting multiple curves.- pos_labelint, float, bool or str, default=None
The class considered the positive class when ROC AUC metrics computed. If not
None, this value is displayed in the x- and y-axes labels.Added in version 0.24.
- Attributes:
- line_matplotlib Artist or list of matplotlib Artists
ROC Curves.
Changed in version 1.7: This attribute can now be a list of Artists, for when multiple curves are plotted.
- chance_level_matplotlib Artist or None
The chance level line. It is
Noneif the chance level is not plotted.Added in version 1.3.
- ax_matplotlib Axes
Axes with ROC Curve.
- figure_matplotlib Figure
Figure containing the curve.
See also
roc_curveCompute Receiver operating characteristic (ROC) curve.
RocCurveDisplay.from_estimatorPlot Receiver Operating Characteristic (ROC) curve given an estimator and some data.
RocCurveDisplay.from_predictionsPlot Receiver Operating Characteristic (ROC) curve given the true and predicted values.
RocCurveDisplay.from_cv_resultsPlot multi-fold ROC curves given cross-validation results.
roc_auc_scoreCompute the area under the ROC curve.
Examples
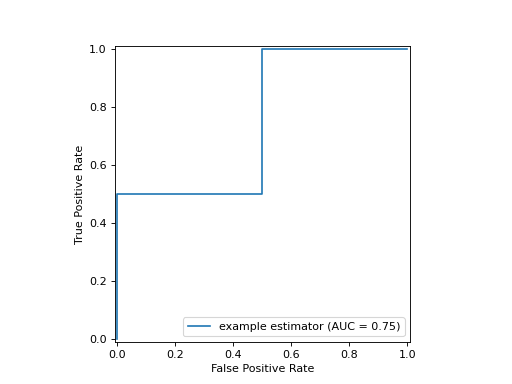
>>> import matplotlib.pyplot as plt
>>> import numpy as np
>>> from sklearn import metrics
>>> y_true = np.array([0, 0, 1, 1])
>>> y_score = np.array([0.1, 0.4, 0.35, 0.8])
>>> fpr, tpr, thresholds = metrics.roc_curve(y_true, y_score)
>>> roc_auc = metrics.auc(fpr, tpr)
>>> display = metrics.RocCurveDisplay(fpr=fpr, tpr=tpr, roc_auc=roc_auc,
...                                   name='example estimator')
>>> display.plot()
<...>
>>> plt.show()
- classmethod from_cv_results(cv_results, X, y, *, sample_weight=None, drop_intermediate=True, response_method='auto', pos_label=None, ax=None, name=None, curve_kwargs=None, plot_chance_level=False, chance_level_kwargs=None, despine=False)[source]#
Create a multi-fold ROC curve display given cross-validation results.
Added in version 1.7.
- Parameters:
- cv_resultsdict
Dictionary as returned by
cross_validateusingreturn_estimator=Trueandreturn_indices=True(i.e., dictionary should contain the keys “estimator” and “indices”).- X{array-like, sparse matrix} of shape (n_samples, n_features)
Input values.
- yarray-like of shape (n_samples,)
Target values.
- sample_weightarray-like of shape (n_samples,), default=None
Sample weights.
- drop_intermediatebool, default=True
Whether to drop some suboptimal thresholds which would not appear on a plotted ROC curve. This is useful in order to create lighter ROC curves.
- response_method{‘predict_proba’, ‘decision_function’, ‘auto’} default=’auto’
Specifies whether to use predict_proba or decision_function as the target response. If set to ‘auto’, predict_proba is tried first and if it does not exist decision_function is tried next.
- pos_labelint, float, bool or str, default=None
The class considered as the positive class when computing the ROC AUC metrics. By default,
estimator.classes_[1](usingestimatorfromcv_results) is considered as the positive class.- axmatplotlib axes, default=None
Axes object to plot on. If
None, a new figure and axes is created.- namestr or list of str, default=None
Name for labeling legend entries. The number of legend entries is determined by the
curve_kwargspassed toplot, and is not affected byname.If a string is provided, it will be used to either label the single legend entry or if there are multiple legend entries, label each individual curve with the same name.
If a list is provided, it will be used to label each curve individually. Passing a list will raise an error if
curve_kwargsis not a list to avoid labeling individual curves that have the same appearance.If
None, no name is shown in the legend.- curve_kwargsdict or list of dict, default=None
Keywords arguments to be passed to matplotlib’s
plotfunction to draw individual ROC curves. If a list is provided the parameters are applied to the ROC curves of each CV fold sequentially and a legend entry is added for each curve. If a single dictionary is provided, the same parameters are applied to all ROC curves and a single legend entry for all curves is added, labeled with the mean ROC AUC score.- plot_chance_levelbool, default=False
Whether to plot the chance level.
- chance_level_kwargsdict, default=None
Keyword arguments to be passed to matplotlib’s
plotfor rendering the chance level line.- despinebool, default=False
Whether to remove the top and right spines from the plot.
- Returns:
- display
RocCurveDisplay The multi-fold ROC curve display.
- display
See also
roc_curveCompute Receiver operating characteristic (ROC) curve.
RocCurveDisplay.from_estimatorPlot Receiver Operating Characteristic (ROC) curve given an estimator and some data.
RocCurveDisplay.from_predictionsROC Curve visualization given the probabilities of scores of a classifier.
roc_auc_scoreCompute the area under the ROC curve.
Examples
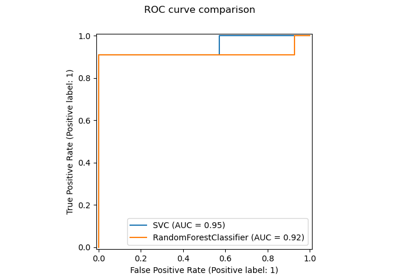
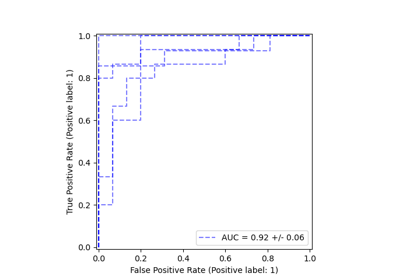
>>> import matplotlib.pyplot as plt
>>> from sklearn.datasets import make_classification
>>> from sklearn.metrics import RocCurveDisplay
>>> from sklearn.model_selection import cross_validate
>>> from sklearn.svm import SVC
>>> X, y = make_classification(random_state=0)
>>> clf = SVC(random_state=0)
>>> cv_results = cross_validate(
...     clf, X, y, cv=3, return_estimator=True, return_indices=True)
>>> RocCurveDisplay.from_cv_results(cv_results, X, y)
<...>
>>> plt.show()

- classmethod from_estimator(estimator, X, y, *, sample_weight=None, drop_intermediate=True, response_method='auto', pos_label=None, name=None, ax=None, curve_kwargs=None, plot_chance_level=False, chance_level_kw=None, despine=False)[source]#
Create a ROC Curve display from an estimator.
For general information regarding
scikit-learnvisualization tools, see the Visualization Guide. For guidance on interpreting these plots, refer to the Model Evaluation Guide.- Parameters:
- estimatorestimator instance
Fitted classifier or a fitted
Pipelinein which the last estimator is a classifier.- X{array-like, sparse matrix} of shape (n_samples, n_features)
Input values.
- yarray-like of shape (n_samples,)
Target values.
- sample_weightarray-like of shape (n_samples,), default=None
Sample weights.
- drop_intermediatebool, default=True
Whether to drop thresholds where the resulting point is collinear with its neighbors in ROC space. This has no effect on the ROC AUC or visual shape of the curve, but reduces the number of plotted points.
- response_method{‘predict_proba’, ‘decision_function’, ‘auto’} default=’auto’
Specifies whether to use predict_proba or decision_function as the target response. If set to ‘auto’, predict_proba is tried first and if it does not exist decision_function is tried next.
- pos_labelint, float, bool or str, default=None
The class considered as the positive class when computing the ROC AUC. By default,
estimators.classes_[1]is considered as the positive class.- namestr, default=None
Name of ROC Curve for labeling. If
None, use the name of the estimator.- axmatplotlib axes, default=None
Axes object to plot on. If
None, a new figure and axes is created.- curve_kwargsdict, default=None
Keywords arguments to be passed to matplotlib’s
plotfunction.Added in version 1.7.
- plot_chance_levelbool, default=False
Whether to plot the chance level.
Added in version 1.3.
- chance_level_kwdict, default=None
Keyword arguments to be passed to matplotlib’s
plotfor rendering the chance level line.Added in version 1.3.
- despinebool, default=False
Whether to remove the top and right spines from the plot.
Added in version 1.6.
- Returns:
- display
RocCurveDisplay The ROC Curve display.
- display
See also
roc_curveCompute Receiver operating characteristic (ROC) curve.
RocCurveDisplay.from_predictionsROC Curve visualization given the probabilities of scores of a classifier.
RocCurveDisplay.from_cv_resultsPlot multi-fold ROC curves given cross-validation results.
roc_auc_scoreCompute the area under the ROC curve.
Examples
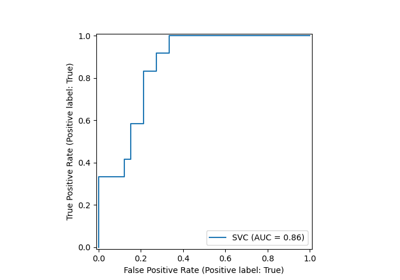
>>> import matplotlib.pyplot as plt
>>> from sklearn.datasets import make_classification
>>> from sklearn.metrics import RocCurveDisplay
>>> from sklearn.model_selection import train_test_split
>>> from sklearn.svm import SVC
>>> X, y = make_classification(random_state=0)
>>> X_train, X_test, y_train, y_test = train_test_split(
...     X, y, random_state=0)
>>> clf = SVC(random_state=0).fit(X_train, y_train)
>>> RocCurveDisplay.from_estimator(
...    clf, X_test, y_test)
<...>
>>> plt.show()
- classmethod from_predictions(y_true, y_score=None, *, sample_weight=None, drop_intermediate=True, pos_label=None, name=None, ax=None, curve_kwargs=None, plot_chance_level=False, chance_level_kw=None, despine=False)[source]#
Plot ROC curve given the true and predicted values.
For general information regarding
scikit-learnvisualization tools, see the Visualization Guide. For guidance on interpreting these plots, refer to the Model Evaluation Guide.Added in version 1.0.
- Parameters:
- y_truearray-like of shape (n_samples,)
True labels.
- y_scorearray-like of shape (n_samples,)
Target scores, can either be probability estimates of the positive class or non-thresholded decision values (as returned by decision_function on some classifiers).
Added in version 1.7:
y_predhas been renamed toy_score.- sample_weightarray-like of shape (n_samples,), default=None
Sample weights.
- drop_intermediatebool, default=True
Whether to drop thresholds where the resulting point is collinear with its neighbors in ROC space. This has no effect on the ROC AUC or visual shape of the curve, but reduces the number of plotted points.
- pos_labelint, float, bool or str, default=None
The label of the positive class when computing the ROC AUC. When
pos_label=None, ify_trueis in {-1, 1} or {0, 1},pos_labelis set to 1, otherwise an error will be raised.- namestr, default=None
Name of ROC curve for legend labeling. If
None, name will be set to"Classifier".- axmatplotlib axes, default=None
Axes object to plot on. If
None, a new figure and axes is created.- curve_kwargsdict, default=None
Keywords arguments to be passed to matplotlib’s
plotfunction.Added in version 1.7.
- plot_chance_levelbool, default=False
Whether to plot the chance level.
Added in version 1.3.
- chance_level_kwdict, default=None
Keyword arguments to be passed to matplotlib’s
plotfor rendering the chance level line.Added in version 1.3.
- despinebool, default=False
Whether to remove the top and right spines from the plot.
Added in version 1.6.
- Returns:
- display
RocCurveDisplay Object that stores computed values.
- display
See also
roc_curveCompute Receiver operating characteristic (ROC) curve.
RocCurveDisplay.from_estimatorROC Curve visualization given an estimator and some data.
RocCurveDisplay.from_cv_resultsPlot multi-fold ROC curves given cross-validation results.
roc_auc_scoreCompute the area under the ROC curve.
Examples
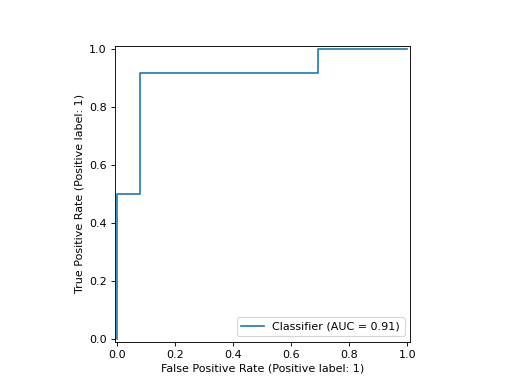
>>> import matplotlib.pyplot as plt
>>> from sklearn.datasets import make_classification
>>> from sklearn.metrics import RocCurveDisplay
>>> from sklearn.model_selection import train_test_split
>>> from sklearn.svm import SVC
>>> X, y = make_classification(random_state=0)
>>> X_train, X_test, y_train, y_test = train_test_split(
...     X, y, random_state=0)
>>> clf = SVC(random_state=0).fit(X_train, y_train)
>>> y_score = clf.decision_function(X_test)
>>> RocCurveDisplay.from_predictions(y_test, y_score)
<...>
>>> plt.show()

- plot(ax=None, *, name=None, curve_kwargs=None, plot_chance_level=False, chance_level_kw=None, despine=False)[source]#
Plot visualization.
- Parameters:
- axmatplotlib axes, default=None
Axes object to plot on. If
None, a new figure and axes is created.- namestr or list of str, default=None
Name for labeling legend entries. The number of legend entries is determined by the
curve_kwargspassed toplot, and is not affected byname.If a string is provided, it will be used to either label the single legend entry or if there are multiple legend entries, label each individual curve with the same name.
If a list is provided, it will be used to label each curve individually. Passing a list will raise an error if
curve_kwargsis not a list to avoid labeling individual curves that have the same appearance.If
None, set tonameprovided atRocCurveDisplayinitialization. If stillNone, no name is shown in the legend.Added in version 1.7.
- curve_kwargsdict or list of dict, default=None
Keywords arguments to be passed to matplotlib’s
plotfunction to draw individual ROC curves. For single curve plotting, should be a dictionary. For multi-curve plotting, if a list is provided the parameters are applied to the ROC curves of each CV fold sequentially and a legend entry is added for each curve. If a single dictionary is provided, the same parameters are applied to all ROC curves and a single legend entry for all curves is added, labeled with the mean ROC AUC score.Added in version 1.7.
- plot_chance_levelbool, default=False
Whether to plot the chance level.
Added in version 1.3.
- chance_level_kwdict, default=None
Keyword arguments to be passed to matplotlib’s
plotfor rendering the chance level line.Added in version 1.3.
- despinebool, default=False
Whether to remove the top and right spines from the plot.
Added in version 1.6.
- Returns:
- display
RocCurveDisplay Object that stores computed values.
- display
Gallery examples#
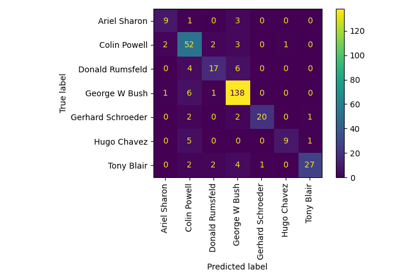
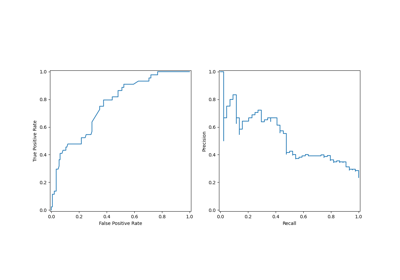
Faces recognition example using eigenfaces and kernel approximation
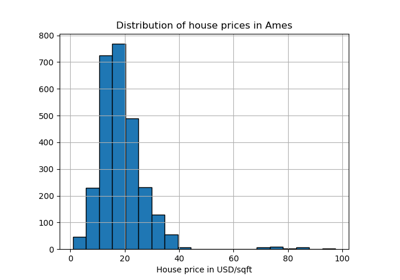
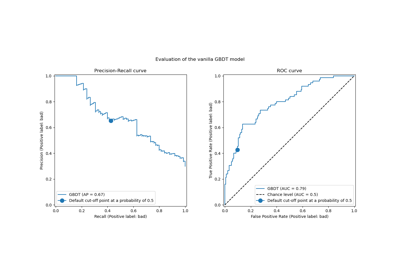
Post-tuning the decision threshold for cost-sensitive learning
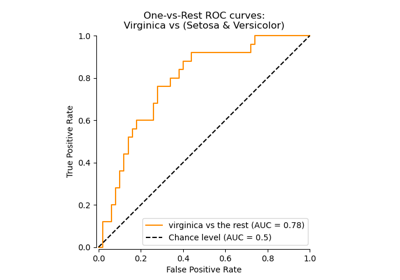
Multiclass Receiver Operating Characteristic (ROC)
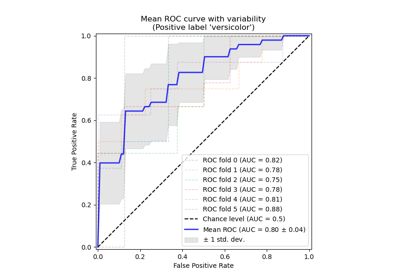
Receiver Operating Characteristic (ROC) with cross validation