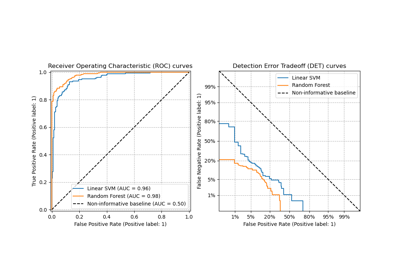
DetCurveDisplay#
- class sklearn.metrics.DetCurveDisplay(*, fpr, fnr, name=None, pos_label=None, estimator_name='deprecated')[source]#
Detection Error Tradeoff (DET) curve visualization.
It is recommended to use
from_estimatororfrom_predictionsto create a visualizer. All parameters are stored as attributes.For general information regarding
scikit-learnvisualization tools, see the Visualization Guide. For guidance on interpreting these plots, refer to the Model Evaluation Guide.Added in version 0.24.
- Parameters:
- fprndarray
False positive rate.
- fnrndarray
False negative rate.
- namestr, default=None
Name for labeling the legend entry. If None, the estimator name is not shown.
Changed in version 1.10:
estimator_namewas deprecated in favor ofname.- pos_labelint, float, bool or str, default=None
The label of the positive class. If not
None, this value is displayed in the x- and y-axes labels.- estimator_namestr, default=None
Name of estimator. If None, the estimator name is not shown.
Deprecated since version 1.10:
estimator_nameis deprecated and will be removed in 1.12. Usenameinstead.
- Attributes:
- line_matplotlib Artist
DET Curve.
- ax_matplotlib Axes
Axes with DET Curve.
- figure_matplotlib Figure
Figure containing the curve.
See also
det_curveCompute error rates for different probability thresholds.
DetCurveDisplay.from_estimatorPlot DET curve given an estimator and some data.
DetCurveDisplay.from_predictionsPlot DET curve given the true and predicted labels.
Examples
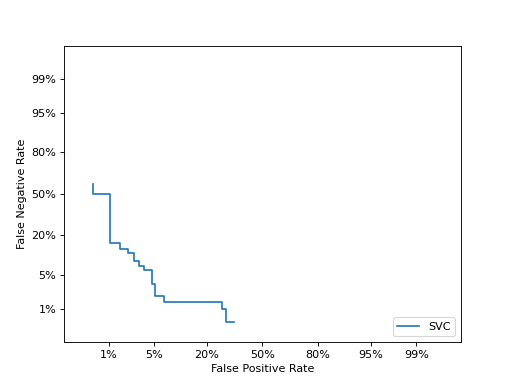
>>> import matplotlib.pyplot as plt
>>> from sklearn.datasets import make_classification
>>> from sklearn.metrics import det_curve, DetCurveDisplay
>>> from sklearn.model_selection import train_test_split
>>> from sklearn.svm import SVC
>>> X, y = make_classification(n_samples=1000, random_state=0)
>>> X_train, X_test, y_train, y_test = train_test_split(
...     X, y, test_size=0.4, random_state=0)
>>> clf = SVC(random_state=0).fit(X_train, y_train)
>>> y_score = clf.decision_function(X_test)
>>> fpr, fnr, _ = det_curve(y_test, y_score)
>>> display = DetCurveDisplay(
...     fpr=fpr, fnr=fnr, name="SVC"
... )
>>> display.plot()
<...>
>>> plt.show()
- classmethod from_estimator(estimator, X, y, *, sample_weight=None, drop_intermediate=True, response_method='auto', pos_label=None, name=None, ax=None, curve_kwargs=None, **kwargs)[source]#
Plot DET curve given an estimator and data.
For general information regarding
scikit-learnvisualization tools, see the Visualization Guide. For guidance on interpreting these plots, refer to the Model Evaluation Guide.Added in version 1.0.
- Parameters:
- estimatorestimator instance
Fitted classifier or a fitted
Pipelinein which the last estimator is a classifier.- X{array-like, sparse matrix} of shape (n_samples, n_features)
Input values.
- yarray-like of shape (n_samples,)
Target values.
- sample_weightarray-like of shape (n_samples,), default=None
Sample weights.
- drop_intermediatebool, default=True
Whether to drop thresholds where true positives (tp) do not change from the previous or subsequent threshold. All points with the same tp value have the same
fnrand thus same y coordinate.Added in version 1.7.
- response_method{‘predict_proba’, ‘decision_function’, ‘auto’} default=’auto’
Specifies whether to use predict_proba or decision_function as the predicted target response. If set to ‘auto’, predict_proba is tried first and if it does not exist decision_function is tried next.
- pos_labelint, float, bool or str, default=None
The label of the positive class. By default,
estimators.classes_[1]is considered as the positive class.- namestr, default=None
Name of DET curve for labeling. If
None, use the name of the estimator.- axmatplotlib axes, default=None
Axes object to plot on. If
None, a new figure and axes is created.- curve_kwargsdict, default=None
Keywords arguments to be passed to matplotlib’s
plotfunction.Added in version 1.10.
- **kwargsdict
Additional keywords arguments passed to matplotlib
plotfunction.Deprecated since version 1.10:
**kwargsis deprecated and will be removed in 1.12. Pass matplotlib arguments tocurve_kwargsas a dictionary instead.
- Returns:
- display
DetCurveDisplay Object that stores computed values.
- display
See also
det_curveCompute error rates for different probability thresholds.
DetCurveDisplay.from_predictionsPlot DET curve given the true and predicted labels.
Examples
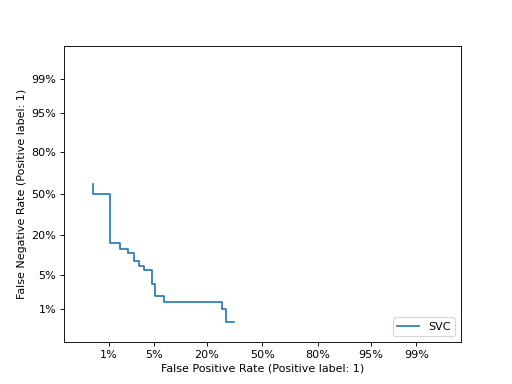
>>> import matplotlib.pyplot as plt
>>> from sklearn.datasets import make_classification
>>> from sklearn.metrics import DetCurveDisplay
>>> from sklearn.model_selection import train_test_split
>>> from sklearn.svm import SVC
>>> X, y = make_classification(n_samples=1000, random_state=0)
>>> X_train, X_test, y_train, y_test = train_test_split(
...     X, y, test_size=0.4, random_state=0)
>>> clf = SVC(random_state=0).fit(X_train, y_train)
>>> DetCurveDisplay.from_estimator(
...    clf, X_test, y_test)
<...>
>>> plt.show()
- classmethod from_predictions(y_true, y_score=None, *, sample_weight=None, drop_intermediate=True, pos_label=None, name=None, ax=None, curve_kwargs=None, y_pred='deprecated', **kwargs)[source]#
Plot the DET curve given the true and predicted labels.
For general information regarding
scikit-learnvisualization tools, see the Visualization Guide. For guidance on interpreting these plots, refer to the Model Evaluation Guide.Added in version 1.0.
- Parameters:
- y_truearray-like of shape (n_samples,)
True labels.
- y_scorearray-like of shape (n_samples,)
Target scores, can either be probability estimates of the positive class or non-thresholded decision values (as returned by decision_function on some classifiers).
Added in version 1.8:
y_predhas been renamed toy_score.- sample_weightarray-like of shape (n_samples,), default=None
Sample weights.
- drop_intermediatebool, default=True
Whether to drop thresholds where true positives (tp) do not change from the previous or subsequent threshold. All points with the same tp value have the same
fnrand thus same y coordinate.Added in version 1.7.
- pos_labelint, float, bool or str, default=None
The label of the positive class. When
pos_label=None, ify_trueis in {-1, 1} or {0, 1},pos_labelis set to 1, otherwise an error will be raised.- namestr, default=None
Name of DET curve for labeling. If
None, name will be set to"Classifier".- axmatplotlib axes, default=None
Axes object to plot on. If
None, a new figure and axes is created.- curve_kwargsdict, default=None
Keywords arguments to be passed to matplotlib’s
plotfunction.Added in version 1.10.
- y_predarray-like of shape (n_samples,)
Target scores, can either be probability estimates of the positive class or non-thresholded decision values (as returned by decision_function on some classifiers).
Deprecated since version 1.8:
y_predis deprecated and will be removed in 1.10. Usey_scoreinstead.- **kwargsdict
Additional keywords arguments passed to matplotlib
plotfunction.Deprecated since version 1.10:
**kwargsis deprecated and will be removed in 1.12. Pass matplotlib arguments tocurve_kwargsas a dictionary instead.
- Returns:
- display
DetCurveDisplay Object that stores computed values.
- display
See also
det_curveCompute error rates for different probability thresholds.
DetCurveDisplay.from_estimatorPlot DET curve given an estimator and some data.
Examples
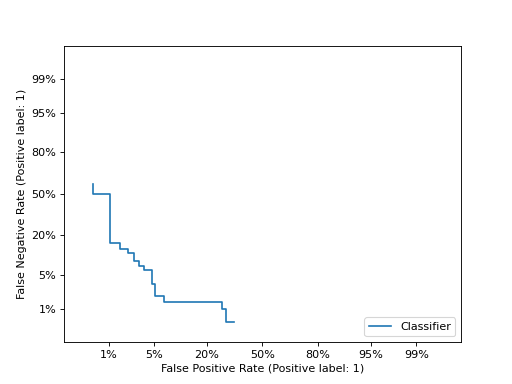
>>> import matplotlib.pyplot as plt
>>> from sklearn.datasets import make_classification
>>> from sklearn.metrics import DetCurveDisplay
>>> from sklearn.model_selection import train_test_split
>>> from sklearn.svm import SVC
>>> X, y = make_classification(n_samples=1000, random_state=0)
>>> X_train, X_test, y_train, y_test = train_test_split(
...     X, y, test_size=0.4, random_state=0)
>>> clf = SVC(random_state=0).fit(X_train, y_train)
>>> y_score = clf.decision_function(X_test)
>>> DetCurveDisplay.from_predictions(
...    y_test, y_score)
<...>
>>> plt.show()
- plot(ax=None, *, name=None, curve_kwargs=None, **kwargs)[source]#
Plot visualization.
- Parameters:
- axmatplotlib axes, default=None
Axes object to plot on. If
None, a new figure and axes is created.- namestr, default=None
Name of DET curve for labeling. If
None, usenameprovided atDetCurveDisplayinitialization, otherwise no labeling is shown.- curve_kwargsdict, default=None
Keywords arguments to be passed to matplotlib’s
plotfunction.Added in version 1.10.
- **kwargsdict
Additional keywords arguments passed to matplotlib
plotfunction.Deprecated since version 1.10:
**kwargsis deprecated and will be removed in 1.12. Pass matplotlib arguments tocurve_kwargsas a dictionary instead.
- Returns:
- display
DetCurveDisplay Object that stores computed values.
- display