LearningCurveDisplay#
- class sklearn.model_selection.LearningCurveDisplay(*, train_sizes, train_scores, test_scores, score_name=None)[source]#
Learning Curve visualization.
It is recommended to use
from_estimatorto create aLearningCurveDisplayinstance. All parameters are stored as attributes.Read more in the User Guide for general information about the visualization API and detailed documentation regarding the learning curve visualization.
Added in version 1.2.
- Parameters:
- train_sizesndarray of shape (n_unique_ticks,)
Numbers of training examples that has been used to generate the learning curve.
- train_scoresndarray of shape (n_ticks, n_cv_folds)
Scores on training sets.
- test_scoresndarray of shape (n_ticks, n_cv_folds)
Scores on test set.
- score_namestr, default=None
The name of the score used in
learning_curve. It will override the name inferred from thescoringparameter. IfscoreisNone, we use"Score"ifnegate_scoreisFalseand"Negative score"otherwise. Ifscoringis a string or a callable, we infer the name. We replace_by spaces and capitalize the first letter. We removeneg_and replace it by"Negative"ifnegate_scoreisFalseor just remove it otherwise.
- Attributes:
- ax_matplotlib Axes
Axes with the learning curve.
- figure_matplotlib Figure
Figure containing the learning curve.
- errorbar_list of matplotlib Artist or None
When the
std_display_styleis"errorbar", this is a list ofmatplotlib.container.ErrorbarContainerobjects. If another style is used,errorbar_isNone.- lines_list of matplotlib Artist or None
When the
std_display_styleis"fill_between", this is a list ofmatplotlib.lines.Line2Dobjects corresponding to the mean train and test scores. If another style is used,line_isNone.- fill_between_list of matplotlib Artist or None
When the
std_display_styleis"fill_between", this is a list ofmatplotlib.collections.PolyCollectionobjects. If another style is used,fill_between_isNone.
See also
sklearn.model_selection.learning_curveCompute the learning curve.
Examples
>>> import matplotlib.pyplot as plt
>>> from sklearn.datasets import load_iris
>>> from sklearn.model_selection import LearningCurveDisplay, learning_curve
>>> from sklearn.tree import DecisionTreeClassifier
>>> X, y = load_iris(return_X_y=True)
>>> tree = DecisionTreeClassifier(random_state=0)
>>> train_sizes, train_scores, test_scores = learning_curve(
...     tree, X, y)
>>> display = LearningCurveDisplay(train_sizes=train_sizes,
...     train_scores=train_scores, test_scores=test_scores, score_name="Score")
>>> display.plot()
<...>
>>> plt.show()

- classmethod from_estimator(estimator, X, y, *, groups=None, train_sizes=array([0.1, 0.33, 0.55, 0.78, 1.]), cv=None, scoring=None, exploit_incremental_learning=False, n_jobs=None, pre_dispatch='all', verbose=0, shuffle=False, random_state=None, error_score=nan, fit_params=None, ax=None, negate_score=False, score_name=None, score_type='both', std_display_style='fill_between', line_kw=None, fill_between_kw=None, errorbar_kw=None)[source]#
Create a learning curve display from an estimator.
Read more in the User Guide for general information about the visualization API and detailed documentation regarding the learning curve visualization.
- Parameters:
- estimatorobject type that implements the “fit” and “predict” methods
An object of that type which is cloned for each validation.
- Xarray-like of shape (n_samples, n_features)
Training data, where
n_samplesis the number of samples andn_featuresis the number of features.- yarray-like of shape (n_samples,) or (n_samples, n_outputs) or None
Target relative to X for classification or regression; None for unsupervised learning.
- groupsarray-like of shape (n_samples,), default=None
Group labels for the samples used while splitting the dataset into train/test set. Only used in conjunction with a “Group” cv instance (e.g.,
GroupKFold).- train_sizesarray-like of shape (n_ticks,), default=np.linspace(0.1, 1.0, 5)
Relative or absolute numbers of training examples that will be used to generate the learning curve. If the dtype is float, it is regarded as a fraction of the maximum size of the training set (that is determined by the selected validation method), i.e. it has to be within (0, 1]. Otherwise it is interpreted as absolute sizes of the training sets. Note that for classification the number of samples usually have to be big enough to contain at least one sample from each class.
- cvint, cross-validation generator or an iterable, default=None
Determines the cross-validation splitting strategy. Possible inputs for cv are:
None, to use the default 5-fold cross validation,
int, to specify the number of folds in a
(Stratified)KFold,an iterable yielding (train, test) splits as arrays of indices.
For int/None inputs, if the estimator is a classifier and
yis either binary or multiclass,StratifiedKFoldis used. In all other cases,KFoldis used. These splitters are instantiated withshuffle=Falseso the splits will be the same across calls.Refer User Guide for the various cross-validation strategies that can be used here.
- scoringstr or callable, default=None
The scoring method to use when calculating the learning curve. Options:
str: see String name scorers for options.
callable: a scorer callable object (e.g., function) with signature
scorer(estimator, X, y). See Callable scorers for details.None: theestimator’s default evaluation criterion is used.
- exploit_incremental_learningbool, default=False
If the estimator supports incremental learning, this will be used to speed up fitting for different training set sizes.
- n_jobsint, default=None
Number of jobs to run in parallel. Training the estimator and computing the score are parallelized over the different training and test sets.
Nonemeans 1 unless in ajoblib.parallel_backendcontext.-1means using all processors. See Glossary for more details.- pre_dispatchint or str, default=’all’
Number of predispatched jobs for parallel execution (default is all). The option can reduce the allocated memory. The str can be an expression like ‘2*n_jobs’.
- verboseint, default=0
Controls the verbosity: the higher, the more messages.
- shufflebool, default=False
Whether to shuffle training data before taking prefixes of it based on`train_sizes`.
- random_stateint, RandomState instance or None, default=None
Used when
shuffleis True. Pass an int for reproducible output across multiple function calls. See Glossary.- error_score‘raise’ or numeric, default=np.nan
Value to assign to the score if an error occurs in estimator fitting. If set to ‘raise’, the error is raised. If a numeric value is given, FitFailedWarning is raised.
- fit_paramsdict, default=None
Parameters to pass to the fit method of the estimator.
- axmatplotlib Axes, default=None
Axes object to plot on. If
None, a new figure and axes is created.- negate_scorebool, default=False
Whether or not to negate the scores obtained through
learning_curve. This is particularly useful when using the error denoted byneg_*inscikit-learn.- score_namestr, default=None
The name of the score used to decorate the y-axis of the plot. It will override the name inferred from the
scoringparameter. IfscoreisNone, we use"Score"ifnegate_scoreisFalseand"Negative score"otherwise. Ifscoringis a string or a callable, we infer the name. We replace_by spaces and capitalize the first letter. We removeneg_and replace it by"Negative"ifnegate_scoreisFalseor just remove it otherwise.- score_type{“test”, “train”, “both”}, default=”both”
The type of score to plot. Can be one of
"test","train", or"both".- std_display_style{“errorbar”, “fill_between”} or None, default=”fill_between”
The style used to display the score standard deviation around the mean score. If
None, no representation of the standard deviation is displayed.- line_kwdict, default=None
Additional keyword arguments passed to the
plt.plotused to draw the mean score.- fill_between_kwdict, default=None
Additional keyword arguments passed to the
plt.fill_betweenused to draw the score standard deviation.- errorbar_kwdict, default=None
Additional keyword arguments passed to the
plt.errorbarused to draw mean score and standard deviation score.
- Returns:
- display
LearningCurveDisplay Object that stores computed values.
- display
Examples
>>> import matplotlib.pyplot as plt
>>> from sklearn.datasets import load_iris
>>> from sklearn.model_selection import LearningCurveDisplay
>>> from sklearn.tree import DecisionTreeClassifier
>>> X, y = load_iris(return_X_y=True)
>>> tree = DecisionTreeClassifier(random_state=0)
>>> LearningCurveDisplay.from_estimator(tree, X, y)
<...>
>>> plt.show()
- plot(ax=None, *, negate_score=False, score_name=None, score_type='both', std_display_style='fill_between', line_kw=None, fill_between_kw=None, errorbar_kw=None)[source]#
Plot visualization.
- Parameters:
- axmatplotlib Axes, default=None
Axes object to plot on. If
None, a new figure and axes is created.- negate_scorebool, default=False
Whether or not to negate the scores obtained through
learning_curve. This is particularly useful when using the error denoted byneg_*inscikit-learn.- score_namestr, default=None
The name of the score used to decorate the y-axis of the plot. It will override the name inferred from the
scoringparameter. IfscoreisNone, we use"Score"ifnegate_scoreisFalseand"Negative score"otherwise. Ifscoringis a string or a callable, we infer the name. We replace_by spaces and capitalize the first letter. We removeneg_and replace it by"Negative"ifnegate_scoreisFalseor just remove it otherwise.- score_type{“test”, “train”, “both”}, default=”both”
The type of score to plot. Can be one of
"test","train", or"both".- std_display_style{“errorbar”, “fill_between”} or None, default=”fill_between”
The style used to display the score standard deviation around the mean score. If None, no standard deviation representation is displayed.
- line_kwdict, default=None
Additional keyword arguments passed to the
plt.plotused to draw the mean score.- fill_between_kwdict, default=None
Additional keyword arguments passed to the
plt.fill_betweenused to draw the score standard deviation.- errorbar_kwdict, default=None
Additional keyword arguments passed to the
plt.errorbarused to draw mean score and standard deviation score.
- Returns:
- display
LearningCurveDisplay Object that stores computed values.
- display
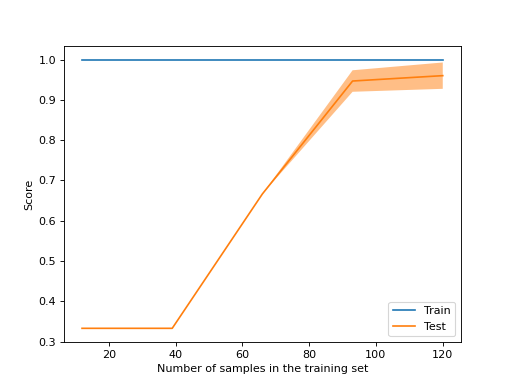
Gallery examples#
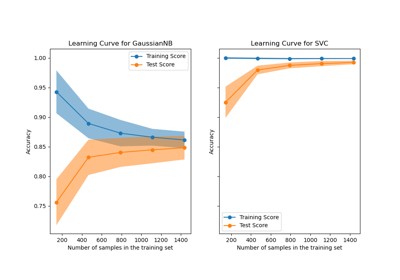
Plotting Learning Curves and Checking Models’ Scalability