Note
Go to the end to download the full example code or to run this example in your browser via JupyterLite or Binder.
Decision Tree Regression with AdaBoost#
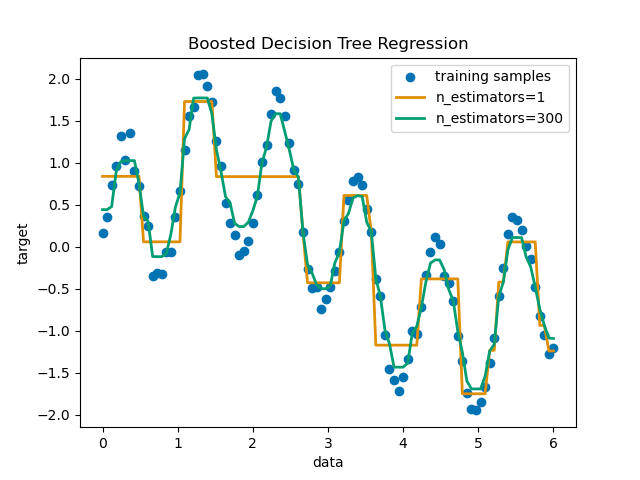
A decision tree is boosted using the AdaBoost.R2 [1] algorithm on a 1D sinusoidal dataset with a small amount of Gaussian noise. 299 boosts (300 decision trees) is compared with a single decision tree regressor. As the number of boosts is increased the regressor can fit more detail.
See Features in Histogram Gradient Boosting Trees for an
example showcasing the benefits of using more efficient regression models such
as HistGradientBoostingRegressor.
Preparing the data#
First, we prepare dummy data with a sinusoidal relationship and some gaussian noise.
# Authors: The scikit-learn developers
# SPDX-License-Identifier: BSD-3-Clause

import numpy as np

rng = np.random.RandomState(1)
X = np.linspace(0, 6, 100)[:, np.newaxis]
y = np.sin(X).ravel() + np.sin(6 * X).ravel() + rng.normal(0, 0.1, X.shape[0])
Training and prediction with DecisionTree and AdaBoost Regressors#
Now, we define the classifiers and fit them to the data.
Then we predict on that same data to see how well they could fit it.
The first regressor is a DecisionTreeRegressor with max_depth=4.
The second regressor is an AdaBoostRegressor with a DecisionTreeRegressor
of max_depth=4 as base learner and will be built with n_estimators=300
of those base learners.
from sklearn.ensemble import AdaBoostRegressor
from sklearn.tree import DecisionTreeRegressor

regr_1 = DecisionTreeRegressor(max_depth=4)

regr_2 = AdaBoostRegressor(
    DecisionTreeRegressor(max_depth=4), n_estimators=300, random_state=rng
)

regr_1.fit(X, y)
regr_2.fit(X, y)

y_1 = regr_1.predict(X)
y_2 = regr_2.predict(X)
Plotting the results#
Finally, we plot how well our two regressors, single decision tree regressor and AdaBoost regressor, could fit the data.
import matplotlib.pyplot as plt
import seaborn as sns

colors = sns.color_palette("colorblind")

plt.figure()
plt.scatter(X, y, color=colors[0], label="training samples")
plt.plot(X, y_1, color=colors[1], label="n_estimators=1", linewidth=2)
plt.plot(X, y_2, color=colors[2], label="n_estimators=300", linewidth=2)
plt.xlabel("data")
plt.ylabel("target")
plt.title("Boosted Decision Tree Regression")
plt.legend()
plt.show()
Total running time of the script: (0 minutes 0.501 seconds)
Related examples
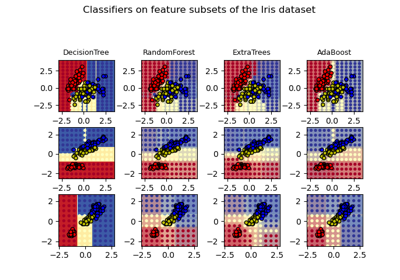
Plot the decision surfaces of ensembles of trees on the iris dataset