Note
Go to the end to download the full example code or to run this example in your browser via JupyterLite or Binder.
A demo of structured Ward hierarchical clustering on an image of coins#
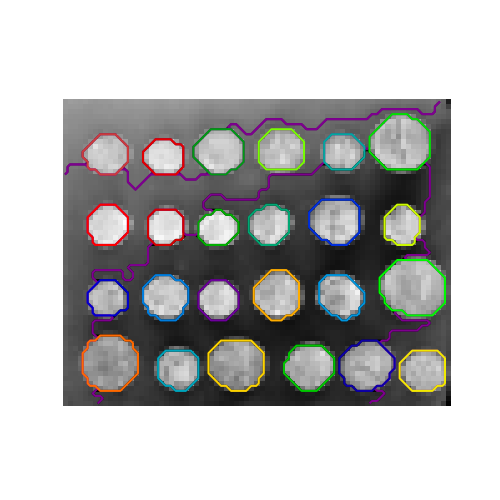
Compute the segmentation of a 2D image with Ward hierarchical clustering. The clustering is spatially constrained in order for each segmented region to be in one piece.
# Authors: The scikit-learn developers
# SPDX-License-Identifier: BSD-3-Clause
Generate data#
from skimage.data import coins

orig_coins = coins()
Resize it to 20% of the original size to speed up the processing Applying a Gaussian filter for smoothing prior to down-scaling reduces aliasing artifacts.
import numpy as np
from scipy.ndimage import gaussian_filter
from skimage.transform import rescale

smoothened_coins = gaussian_filter(orig_coins, sigma=2)
rescaled_coins = rescale(
    smoothened_coins,
    0.2,
    mode="reflect",
    anti_aliasing=False,
)

X = np.reshape(rescaled_coins, (-1, 1))
Define structure of the data#
Pixels are connected to their neighbors.
from sklearn.feature_extraction.image import grid_to_graph

connectivity = grid_to_graph(*rescaled_coins.shape)
Compute clustering#
import time as time

from sklearn.cluster import AgglomerativeClustering

print("Compute structured hierarchical clustering...")
st = time.time()
n_clusters = 27  # number of regions
ward = AgglomerativeClustering(
    n_clusters=n_clusters, linkage="ward", connectivity=connectivity
)
ward.fit(X)
label = np.reshape(ward.labels_, rescaled_coins.shape)
print(f"Elapsed time: {time.time() - st:.3f}s")
print(f"Number of pixels: {label.size}")
print(f"Number of clusters: {np.unique(label).size}")
Compute structured hierarchical clustering...
Elapsed time: 0.165s
Number of pixels: 4697
Number of clusters: 27
Plot the results on an image#
Agglomerative clustering is able to segment each coin however, we have had to
use a n_cluster larger than the number of coins because the segmentation
is finding a large in the background.
import matplotlib.pyplot as plt

plt.figure(figsize=(5, 5))
plt.imshow(rescaled_coins, cmap=plt.cm.gray)
for l in range(n_clusters):
    plt.contour(
        label == l,
        colors=[
            plt.cm.nipy_spectral(l / float(n_clusters)),
        ],
    )
plt.axis("off")
plt.show()
Total running time of the script: (0 minutes 0.321 seconds)
Related examples
Hierarchical clustering with and without structure
Comparing different hierarchical linkage methods on toy datasets
Comparing different clustering algorithms on toy datasets
