Note
Go to the end to download the full example code or to run this example in your browser via JupyterLite or Binder.
Recursive feature elimination with cross-validation#
A Recursive Feature Elimination (RFE) example with automatic tuning of the number of features selected with cross-validation.
# Authors: The scikit-learn developers
# SPDX-License-Identifier: BSD-3-Clause
Data generation#
We build a classification task using 3 informative features. The introduction of 2 additional redundant (i.e. correlated) features has the effect that the selected features vary depending on the cross-validation fold. The remaining features are non-informative as they are drawn at random.
from sklearn.datasets import make_classification

n_features = 15
feat_names = [f"feature_{i}" for i in range(15)]

X, y = make_classification(
    n_samples=500,
    n_features=n_features,
    n_informative=3,
    n_redundant=2,
    n_repeated=0,
    n_classes=8,
    n_clusters_per_class=1,
    class_sep=0.8,
    random_state=0,
)
Model training and selection#
We create the RFE object and compute the cross-validated scores. The scoring strategy “accuracy” optimizes the proportion of correctly classified samples.
from sklearn.feature_selection import RFECV
from sklearn.linear_model import LogisticRegression
from sklearn.model_selection import StratifiedKFold

min_features_to_select = 1  # Minimum number of features to consider
clf = LogisticRegression()
cv = StratifiedKFold(5)

rfecv = RFECV(
    estimator=clf,
    step=1,
    cv=cv,
    scoring="accuracy",
    min_features_to_select=min_features_to_select,
    n_jobs=2,
)
rfecv.fit(X, y)

print(f"Optimal number of features: {rfecv.n_features_}")
Optimal number of features: 3
In the present case, the model with 3 features (which corresponds to the true generative model) is found to be the most optimal.
Plot number of features VS. cross-validation scores#
import matplotlib.pyplot as plt
import pandas as pd

data = {
    key: value
    for key, value in rfecv.cv_results_.items()
    if key in ["n_features", "mean_test_score", "std_test_score"]
}
cv_results = pd.DataFrame(data)
plt.figure()
plt.xlabel("Number of features selected")
plt.ylabel("Mean test accuracy")
plt.errorbar(
    x=cv_results["n_features"],
    y=cv_results["mean_test_score"],
    yerr=cv_results["std_test_score"],
)
plt.title("Recursive Feature Elimination \nwith correlated features")
plt.show()
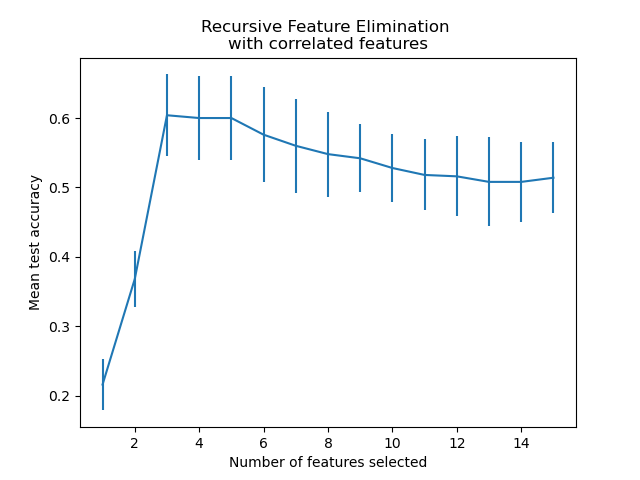
From the plot above one can further notice a plateau of equivalent scores (similar mean value and overlapping errorbars) for 3 to 5 selected features. This is the result of introducing correlated features. Indeed, the optimal model selected by the RFE can lie within this range, depending on the cross-validation technique. The test accuracy decreases above 5 selected features, this is, keeping non-informative features leads to over-fitting and is therefore detrimental for the statistical performance of the models.
import numpy as np

for i in range(cv.n_splits):
    mask = rfecv.cv_results_[f"split{i}_support"][
        rfecv.n_features_ - 1
    ]  # mask of features selected by the RFE
    features_selected = np.ma.compressed(np.ma.masked_array(feat_names, mask=1 - mask))
    print(f"Features selected in fold {i}: {features_selected}")
Features selected in fold 0: ['feature_3' 'feature_4' 'feature_8']
Features selected in fold 1: ['feature_3' 'feature_4' 'feature_8']
Features selected in fold 2: ['feature_3' 'feature_4' 'feature_8']
Features selected in fold 3: ['feature_3' 'feature_4' 'feature_8']
Features selected in fold 4: ['feature_3' 'feature_4' 'feature_8']
In the five folds, the selected features are consistent. This is good news, it means that the selection is stable across folds, and it confirms that these features are the most informative ones.
Total running time of the script: (0 minutes 0.906 seconds)
Related examples
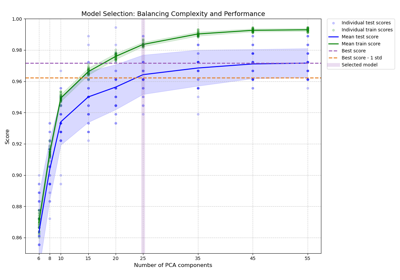
Balance model complexity and cross-validated score


Custom refit strategy of a grid search with cross-validation
Post-hoc tuning the cut-off point of decision function
