Note
Go to the end to download the full example code or to run this example in your browser via JupyterLite or Binder.
Gaussian processes on discrete data structures#
This example illustrates the use of Gaussian processes for regression and classification tasks on data that are not in fixed-length feature vector form. This is achieved through the use of kernel functions that operate directly on discrete structures such as variable-length sequences, trees, and graphs.
Specifically, here the input variables are some gene sequences stored as variable-length strings consisting of letters ‘A’, ‘T’, ‘C’, and ‘G’, while the output variables are floating point numbers and True/False labels in the regression and classification tasks, respectively.
A kernel between the gene sequences is defined using R-convolution [1] by integrating a binary letter-wise kernel over all pairs of letters among a pair of strings.
This example will generate three figures.
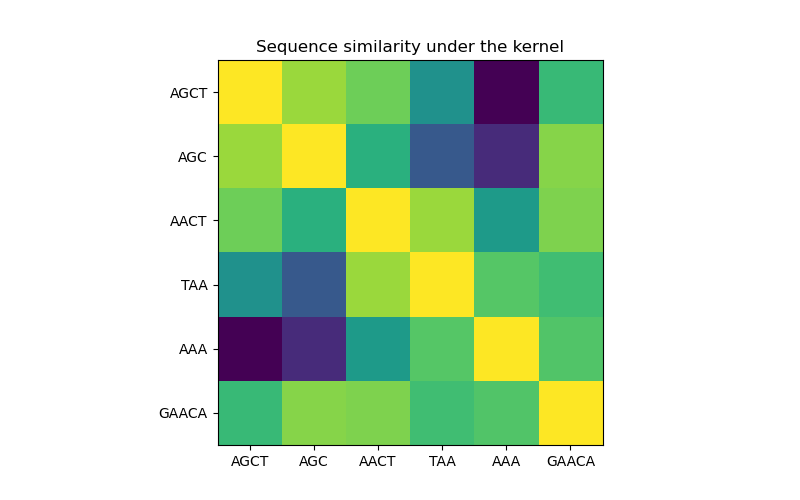
In the first figure, we visualize the value of the kernel, i.e. the similarity of the sequences, using a colormap. Brighter color here indicates higher similarity.
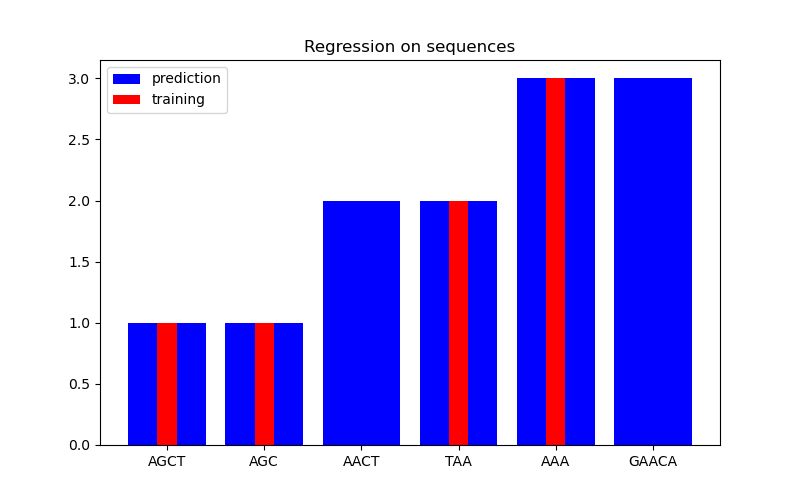
In the second figure, we show some regression result on a dataset of 6 sequences. Here we use the 1st, 2nd, 4th, and 5th sequences as the training set to make predictions on the 3rd and 6th sequences.
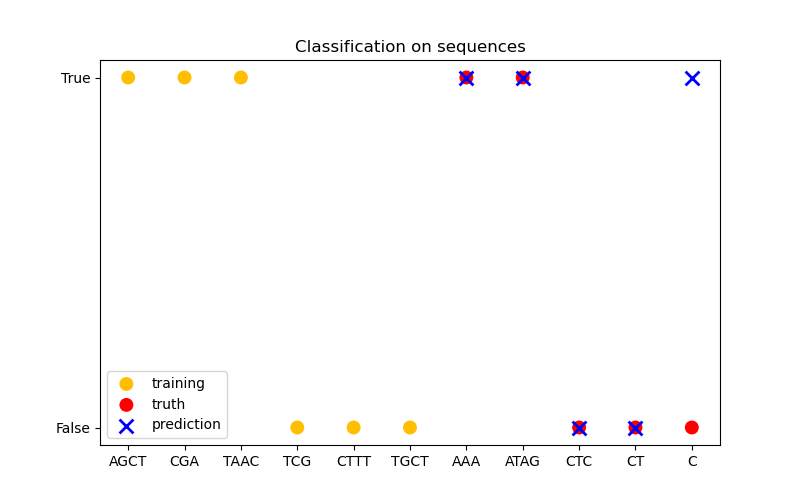
In the third figure, we demonstrate a classification model by training on 6 sequences and make predictions on another 5 sequences. The ground truth here is simply whether there is at least one ‘A’ in the sequence. Here the model makes four correct classifications and fails on one.
# Authors: The scikit-learn developers
# SPDX-License-Identifier: BSD-3-Clause
import numpy as np

from sklearn.base import clone
from sklearn.gaussian_process import GaussianProcessClassifier, GaussianProcessRegressor
from sklearn.gaussian_process.kernels import GenericKernelMixin, Hyperparameter, Kernel


class SequenceKernel(GenericKernelMixin, Kernel):
    """
    A minimal (but valid) convolutional kernel for sequences of variable
    lengths."""

    def __init__(self, baseline_similarity=0.5, baseline_similarity_bounds="fixed"):
        self.baseline_similarity = baseline_similarity
        self.baseline_similarity_bounds = baseline_similarity_bounds

    @property
    def hyperparameter_baseline_similarity(self):
        return Hyperparameter(
            "baseline_similarity", "numeric", self.baseline_similarity_bounds
        )

    def _f(self, s1, s2):
        """
        kernel value between a pair of sequences
        """
        return sum(
            [1.0 if c1 == c2 else self.baseline_similarity for c1 in s1 for c2 in s2]
        )

    def _g(self, s1, s2):
        """
        kernel derivative between a pair of sequences
        """
        return sum([0.0 if c1 == c2 else 1.0 for c1 in s1 for c2 in s2])

    def __call__(self, X, Y=None, eval_gradient=False):
        if Y is None:
            Y = X

        if eval_gradient:
            return (
                np.array([[self._f(x, y) for y in Y] for x in X]),
                np.array([[[self._g(x, y)] for y in Y] for x in X]),
            )
        else:
            return np.array([[self._f(x, y) for y in Y] for x in X])

    def diag(self, X):
        return np.array([self._f(x, x) for x in X])

    def is_stationary(self):
        return False

    def clone_with_theta(self, theta):
        cloned = clone(self)
        cloned.theta = theta
        return cloned
Note
Here, we freeze the value of baseline_similarity by setting
baseline_similarity_bounds="fixed" as LBFGS would otherwise fail to
optimize the value of this kernel parameter for some unknown reason.
kernel = SequenceKernel()
Sequence similarity matrix under the kernel#
import matplotlib.pyplot as plt

X = np.array(["AGCT", "AGC", "AACT", "TAA", "AAA", "GAACA"])

K = kernel(X)
D = kernel.diag(X)

plt.figure(figsize=(8, 5))
plt.imshow(np.diag(D**-0.5).dot(K).dot(np.diag(D**-0.5)))
plt.xticks(np.arange(len(X)), X)
plt.yticks(np.arange(len(X)), X)
plt.title("Sequence similarity under the kernel")
plt.show()
Regression#
X = np.array(["AGCT", "AGC", "AACT", "TAA", "AAA", "GAACA"])
Y = np.array([1.0, 1.0, 2.0, 2.0, 3.0, 3.0])

training_idx = [0, 1, 3, 4]
gp = GaussianProcessRegressor(kernel=kernel)
gp.fit(X[training_idx], Y[training_idx])

plt.figure(figsize=(8, 5))
plt.bar(np.arange(len(X)), gp.predict(X), color="b", label="prediction")
plt.bar(training_idx, Y[training_idx], width=0.2, color="r", alpha=1, label="training")
plt.xticks(np.arange(len(X)), X)
plt.title("Regression on sequences")
plt.legend()
plt.show()
Classification#
X_train = np.array(["AGCT", "CGA", "TAAC", "TCG", "CTTT", "TGCT"])
# whether there are 'A's in the sequence
Y_train = np.array([True, True, True, False, False, False])

gp = GaussianProcessClassifier(kernel)
gp.fit(X_train, Y_train)

X_test = ["AAA", "ATAG", "CTC", "CT", "C"]
Y_test = [True, True, False, False, False]

plt.figure(figsize=(8, 5))
plt.scatter(
    np.arange(len(X_train)),
    [1.0 if c else -1.0 for c in Y_train],
    s=100,
    marker="o",
    edgecolor="none",
    facecolor=(1, 0.75, 0),
    label="training",
)
plt.scatter(
    len(X_train) + np.arange(len(X_test)),
    [1.0 if c else -1.0 for c in Y_test],
    s=100,
    marker="o",
    edgecolor="none",
    facecolor="r",
    label="truth",
)
plt.scatter(
    len(X_train) + np.arange(len(X_test)),
    [1.0 if c else -1.0 for c in gp.predict(X_test)],
    s=100,
    marker="x",
    facecolor="b",
    linewidth=2,
    label="prediction",
)
plt.xticks(np.arange(len(X_train) + len(X_test)), np.concatenate((X_train, X_test)))
plt.yticks([-1, 1], [False, True])
plt.title("Classification on sequences")
plt.legend()
plt.show()
Total running time of the script: (0 minutes 0.300 seconds)
Related examples
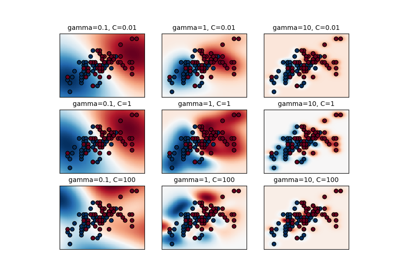
Gaussian process classification (GPC) on iris dataset
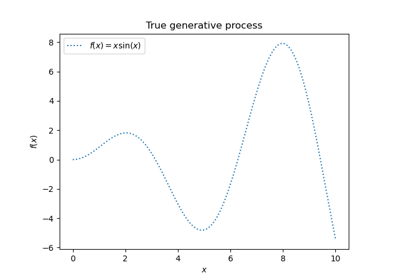
Gaussian Processes regression: basic introductory example
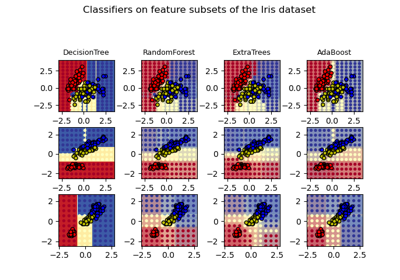
Plot the decision surfaces of ensembles of trees on the iris dataset
