Note
Go to the end to download the full example code or to run this example in your browser via JupyterLite or Binder.
A demo of the Spectral Co-Clustering algorithm#
This example demonstrates how to generate a dataset and bicluster it using the Spectral Co-Clustering algorithm.
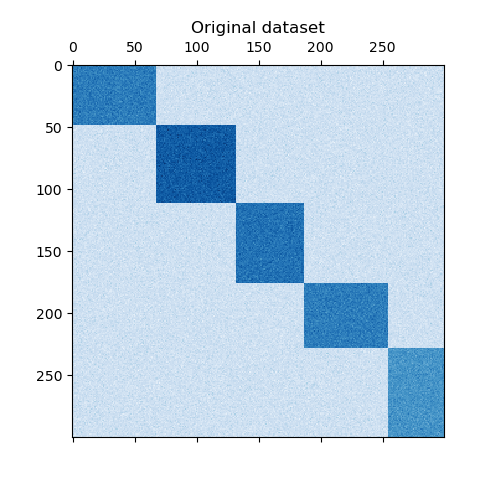
The dataset is generated using the make_biclusters function, which
creates a matrix of small values and implants bicluster with large
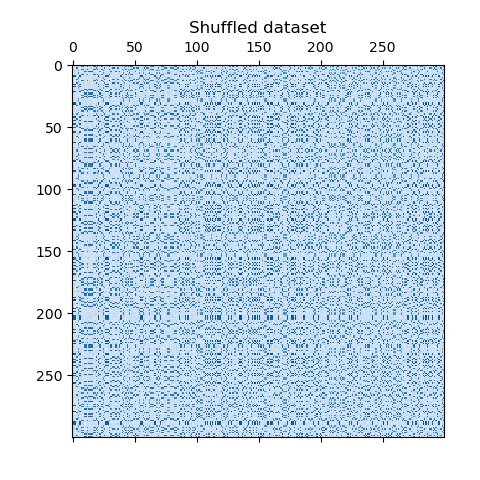
values. The rows and columns are then shuffled and passed to the
Spectral Co-Clustering algorithm. Rearranging the shuffled matrix to
make biclusters contiguous shows how accurately the algorithm found
the biclusters.
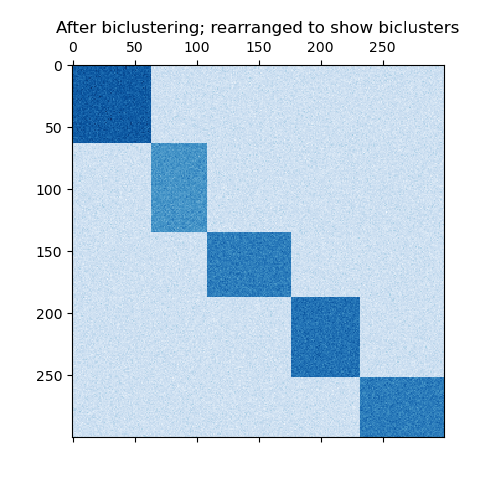
consensus score: 1.000
# Authors: The scikit-learn developers
# SPDX-License-Identifier: BSD-3-Clause

import numpy as np
from matplotlib import pyplot as plt

from sklearn.cluster import SpectralCoclustering
from sklearn.datasets import make_biclusters
from sklearn.metrics import consensus_score

data, rows, columns = make_biclusters(
    shape=(300, 300), n_clusters=5, noise=5, shuffle=False, random_state=0
)

plt.matshow(data, cmap=plt.cm.Blues)
plt.title("Original dataset")

# shuffle clusters
rng = np.random.RandomState(0)
row_idx = rng.permutation(data.shape[0])
col_idx = rng.permutation(data.shape[1])
data = data[row_idx][:, col_idx]

plt.matshow(data, cmap=plt.cm.Blues)
plt.title("Shuffled dataset")

model = SpectralCoclustering(n_clusters=5, random_state=0)
model.fit(data)
score = consensus_score(model.biclusters_, (rows[:, row_idx], columns[:, col_idx]))

print("consensus score: {:.3f}".format(score))

fit_data = data[np.argsort(model.row_labels_)]
fit_data = fit_data[:, np.argsort(model.column_labels_)]

plt.matshow(fit_data, cmap=plt.cm.Blues)
plt.title("After biclustering; rearranged to show biclusters")

plt.show()
Total running time of the script: (0 minutes 0.306 seconds)
Related examples

Biclustering documents with the Spectral Co-clustering algorithm

A demo of structured Ward hierarchical clustering on an image of coins
