Note
Go to the end to download the full example code or to run this example in your browser via JupyterLite or Binder.
Test with permutations the significance of a classification score#
This example demonstrates the use of
permutation_test_score to evaluate the
significance of a cross-validated score using permutations.
# Authors: The scikit-learn developers
# SPDX-License-Identifier: BSD-3-Clause
Dataset#
We will use the Iris plants dataset, which consists of measurements taken from 3 Iris species. Our model will use the measurements to predict the iris species.
For comparison, we also generate some random feature data (i.e., 20 features), uncorrelated with the class labels in the iris dataset.
import numpy as np

n_uncorrelated_features = 20
rng = np.random.RandomState(seed=0)
# Use same number of samples as in iris and 20 features
X_rand = rng.normal(size=(X.shape[0], n_uncorrelated_features))
Permutation test score#
Next, we calculate the
permutation_test_score for both, the original
iris dataset (where there’s a strong relationship between features and labels) and
the randomly generated features with iris labels (where no dependency between features
and labels is expected). We use the
SVC classifier and Accuracy score to evaluate
the model at each round.
permutation_test_score generates a null
distribution by calculating the accuracy of the classifier
on 1000 different permutations of the dataset, where features
remain the same but labels undergo different random permutations. This is the
distribution for the null hypothesis which states there is no dependency
between the features and labels. An empirical p-value is then calculated as
the proportion of permutations, for which the score obtained by the model trained on
the permutation, is greater than or equal to the score obtained using the original
data.
from sklearn.model_selection import StratifiedKFold, permutation_test_score
from sklearn.svm import SVC

clf = SVC(kernel="linear", random_state=7)
cv = StratifiedKFold(n_splits=2, shuffle=True, random_state=0)

score_iris, perm_scores_iris, pvalue_iris = permutation_test_score(
    clf, X, y, scoring="accuracy", cv=cv, n_permutations=1000
)

score_rand, perm_scores_rand, pvalue_rand = permutation_test_score(
    clf, X_rand, y, scoring="accuracy", cv=cv, n_permutations=1000
)
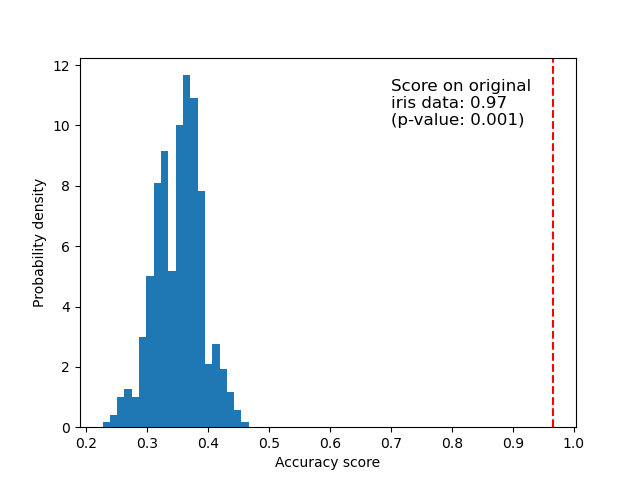
Original data#
Below we plot a histogram of the permutation scores (the null distribution). The red line indicates the score obtained by the classifier on the original data (without permuted labels). The score is much better than those obtained by using permuted data and the p-value is thus very low. This indicates that there is a low likelihood that this good score would be obtained by chance alone. It provides evidence that the iris dataset contains real dependency between features and labels and the classifier was able to utilize this to obtain good results. The low p-value can lead us to reject the null hypothesis.
import matplotlib.pyplot as plt

fig, ax = plt.subplots()

ax.hist(perm_scores_iris, bins=20, density=True)
ax.axvline(score_iris, ls="--", color="r")
score_label = (
    f"Score on original\niris data: {score_iris:.2f}\n(p-value: {pvalue_iris:.3f})"
)
ax.text(0.7, 10, score_label, fontsize=12)
ax.set_xlabel("Accuracy score")
_ = ax.set_ylabel("Probability density")
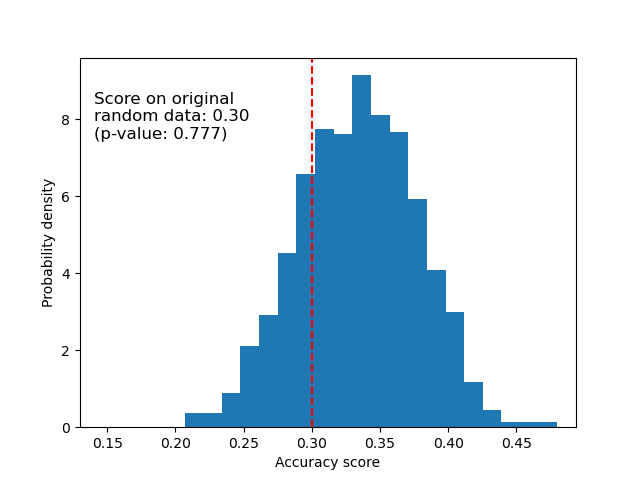
Random data#
Below we plot the null distribution for the randomized data. The permutation scores are similar to those obtained using the original iris dataset because the permutation always destroys any feature-label dependency present. The score obtained on the randomized data in this case though, is very poor. This results in a large p-value, confirming that there was no feature-label dependency in the randomized data.
fig, ax = plt.subplots()

ax.hist(perm_scores_rand, bins=20, density=True)
ax.set_xlim(0.13)
ax.axvline(score_rand, ls="--", color="r")
score_label = (
    f"Score on original\nrandom data: {score_rand:.2f}\n(p-value: {pvalue_rand:.3f})"
)
ax.text(0.14, 7.5, score_label, fontsize=12)
ax.set_xlabel("Accuracy score")
ax.set_ylabel("Probability density")
plt.show()
Another possible reason for obtaining a high p-value could be that the classifier was not able to use the structure in the data. In this case, the p-value would only be low for classifiers that are able to utilize the dependency present. In our case above, where the data is random, all classifiers would have a high p-value as there is no structure present in the data. We might or might not fail to reject the null hypothesis depending on whether the p-value is high on a more appropriate estimator as well.
Finally, note that this test has been shown to produce low p-values even if there is only weak structure in the data [1].
References
Total running time of the script: (0 minutes 17.608 seconds)
Related examples
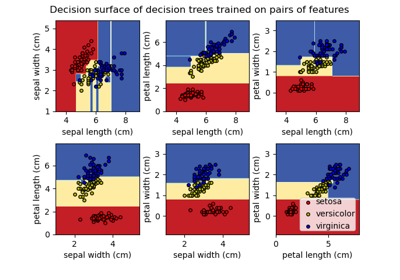
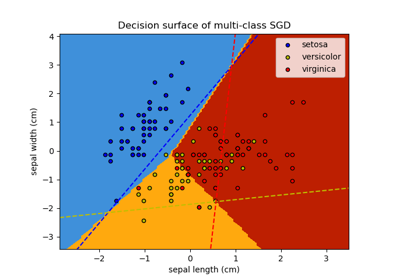
Plot the decision surface of decision trees trained on the iris dataset
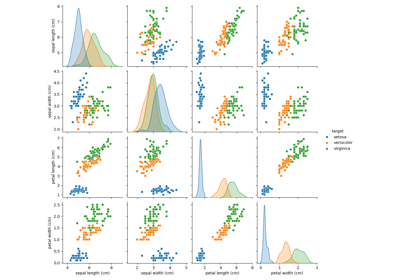
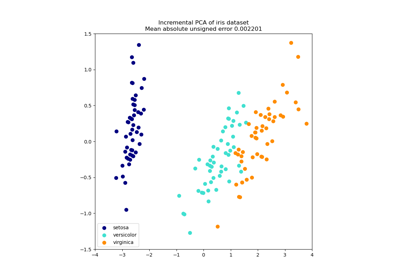
Principal Component Analysis (PCA) on Iris Dataset