
Note
Go to the end to download the full example code or to run this example in your browser via JupyterLite or Binder.
Gaussian process classification (GPC) on iris dataset#
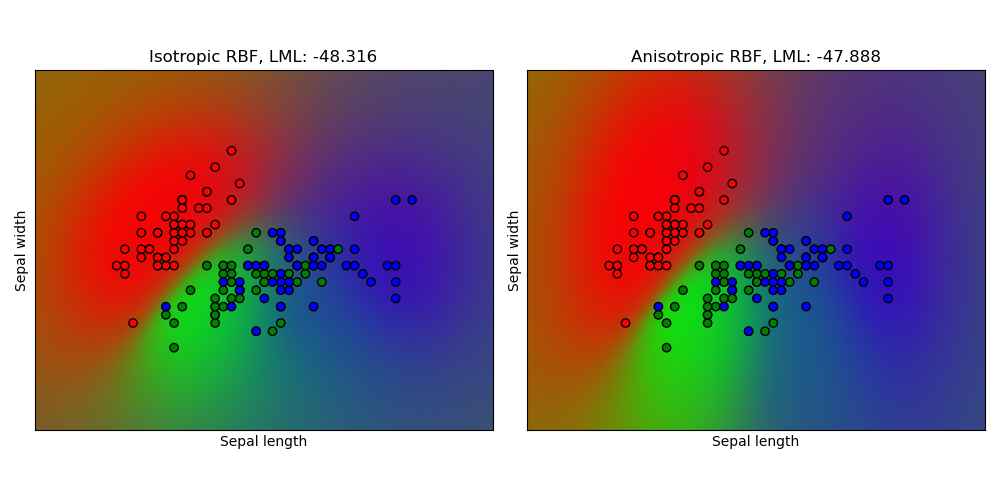
This example illustrates the predicted probability of GPC for an isotropic and anisotropic RBF kernel on a two-dimensional version for the iris-dataset. The anisotropic RBF kernel obtains slightly higher log-marginal-likelihood by assigning different length-scales to the two feature dimensions.
# Authors: The scikit-learn developers
# SPDX-License-Identifier: BSD-3-Clause

import matplotlib as mpl
import matplotlib.pyplot as plt
import numpy as np

from sklearn import datasets
from sklearn.gaussian_process import GaussianProcessClassifier
from sklearn.gaussian_process.kernels import RBF
from sklearn.inspection import DecisionBoundaryDisplay

# import some data to play with
iris = datasets.load_iris()
X = iris.data[:, :2]  # we only take the first two features.
y = np.array(iris.target)

kernel = 1.0 * RBF([1.0])
gpc_rbf_isotropic = GaussianProcessClassifier(kernel=kernel).fit(X, y)
kernel = 1.0 * RBF([1.0, 1.0])
gpc_rbf_anisotropic = GaussianProcessClassifier(kernel=kernel).fit(X, y)

titles = ["Isotropic RBF", "Anisotropic RBF"]
plt.figure(figsize=(10, 5))

for i, clf in enumerate((gpc_rbf_isotropic, gpc_rbf_anisotropic)):
    plt.subplot(1, 2, i + 1)

    # Visualize the decision boundary as class regions shaded in the predicted
    # probability of the winning class
    boundary_display = DecisionBoundaryDisplay.from_estimator(
        clf, X, ax=plt.gca(), response_method="predict_proba", alpha=0.5
    )

    # Plot also the training points reusing the boundary display color scheme
    plt.scatter(
        X[:, 0],
        X[:, 1],
        c=y,
        cmap=mpl.colors.ListedColormap(boundary_display.target_colors_),
        edgecolors="k",
    )

    plt.xlabel("Sepal length")
    plt.ylabel("Sepal width")
    plt.xticks(())
    plt.yticks(())
    plt.title(
        "%s, LML: %.3f" % (titles[i], clf.log_marginal_likelihood(clf.kernel_.theta))
    )

plt.tight_layout()
plt.show()
Total running time of the script: (0 minutes 0.429 seconds)


Related examples
Illustration of Gaussian process classification (GPC) on the XOR dataset
Illustration of Gaussian process classification (GPC) on the XOR dataset
Principal Component Analysis (PCA) on Iris Dataset
Principal Component Analysis (PCA) on Iris Dataset
Plot the decision surface of decision trees trained on the iris dataset
Plot the decision surface of decision trees trained on the iris dataset
