Note
Go to the end to download the full example code or to run this example in your browser via JupyterLite or Binder.
Comparison between grid search and successive halving#
This example compares the parameter search performed by
HalvingGridSearchCV and
GridSearchCV.
# Authors: The scikit-learn developers
# SPDX-License-Identifier: BSD-3-Clause

from time import time

import matplotlib.pyplot as plt
import numpy as np
import pandas as pd

from sklearn import datasets
from sklearn.experimental import enable_halving_search_cv  # noqa: F401
from sklearn.model_selection import GridSearchCV, HalvingGridSearchCV
from sklearn.svm import SVC
We first define the parameter space for an SVC
estimator, and compute the time required to train a
HalvingGridSearchCV instance, as well as a
GridSearchCV instance.
rng = np.random.RandomState(0)
X, y = datasets.make_classification(n_samples=1000, random_state=rng)

gammas = [1e-1, 1e-2, 1e-3, 1e-4, 1e-5, 1e-6, 1e-7]
Cs = [1, 10, 100, 1e3, 1e4, 1e5]
param_grid = {"gamma": gammas, "C": Cs}

clf = SVC(random_state=rng)

tic = time()
gsh = HalvingGridSearchCV(
    estimator=clf, param_grid=param_grid, factor=2, random_state=rng
)
gsh.fit(X, y)
gsh_time = time() - tic

tic = time()
gs = GridSearchCV(estimator=clf, param_grid=param_grid)
gs.fit(X, y)
gs_time = time() - tic
We now plot heatmaps for both search estimators.
def make_heatmap(ax, gs, is_sh=False, make_cbar=False):
    """Helper to make a heatmap."""
    results = pd.DataFrame(gs.cv_results_)
    results[["param_C", "param_gamma"]] = results[["param_C", "param_gamma"]].astype(
        np.float64
    )
    if is_sh:
        # SH dataframe: get mean_test_score values for the highest iter
        scores_matrix = results.sort_values("iter").pivot_table(
            index="param_gamma",
            columns="param_C",
            values="mean_test_score",
            aggfunc="last",
        )
    else:
        scores_matrix = results.pivot(
            index="param_gamma", columns="param_C", values="mean_test_score"
        )

    im = ax.imshow(scores_matrix)

    ax.set_xticks(np.arange(len(Cs)))
    ax.set_xticklabels(["{:.0E}".format(x) for x in Cs])
    ax.set_xlabel("C", fontsize=15)

    ax.set_yticks(np.arange(len(gammas)))
    ax.set_yticklabels(["{:.0E}".format(x) for x in gammas])
    ax.set_ylabel("gamma", fontsize=15)

    # Rotate the tick labels and set their alignment.
    plt.setp(ax.get_xticklabels(), rotation=45, ha="right", rotation_mode="anchor")

    if is_sh:
        iterations = results.pivot_table(
            index="param_gamma", columns="param_C", values="iter", aggfunc="max"
        ).values
        for i in range(len(gammas)):
            for j in range(len(Cs)):
                ax.text(
                    j,
                    i,
                    iterations[i, j],
                    ha="center",
                    va="center",
                    color="w",
                    fontsize=20,
                )

    if make_cbar:
        fig.subplots_adjust(right=0.8)
        cbar_ax = fig.add_axes([0.85, 0.15, 0.05, 0.7])
        fig.colorbar(im, cax=cbar_ax)
        cbar_ax.set_ylabel("mean_test_score", rotation=-90, va="bottom", fontsize=15)


fig, axes = plt.subplots(ncols=2, sharey=True)
ax1, ax2 = axes

make_heatmap(ax1, gsh, is_sh=True)
make_heatmap(ax2, gs, make_cbar=True)

ax1.set_title("Successive Halving\ntime = {:.3f}s".format(gsh_time), fontsize=15)
ax2.set_title("GridSearch\ntime = {:.3f}s".format(gs_time), fontsize=15)

plt.show()
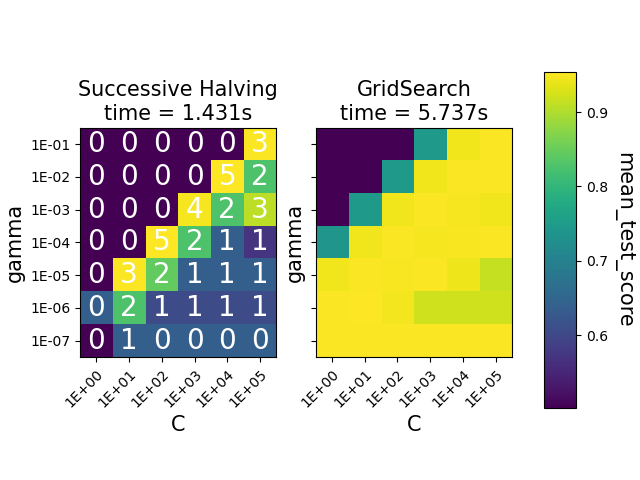
The heatmaps show the mean test score of the parameter combinations for an
SVC instance. The
HalvingGridSearchCV also shows the
iteration at which the combinations where last used. The combinations marked
as 0 were only evaluated at the first iteration, while the ones with
5 are the parameter combinations that are considered the best ones.
We can see that the HalvingGridSearchCV
class is able to find parameter combinations that are just as accurate as
GridSearchCV, in much less time.
Total running time of the script: (0 minutes 9.649 seconds)
Related examples
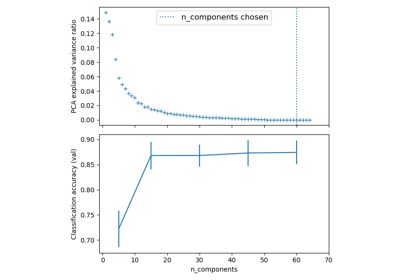
Pipelining: chaining a PCA and a logistic regression

Comparing randomized search and grid search for hyperparameter estimation
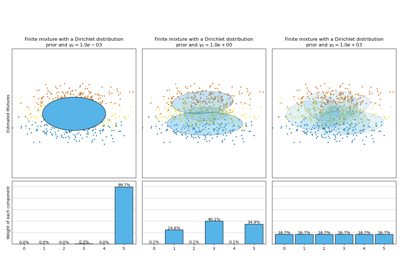
Concentration Prior Type Analysis of Variation Bayesian Gaussian Mixture
