Note
Go to the end to download the full example code or to run this example in your browser via JupyterLite or Binder.
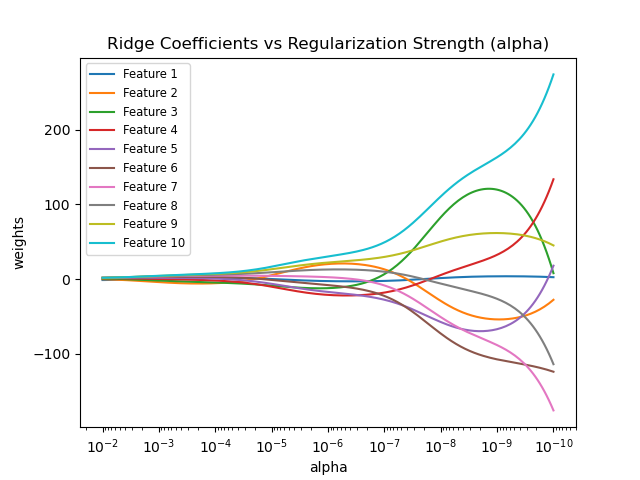
Plot Ridge coefficients as a function of the regularization#
Shows the effect of collinearity in the coefficients of an estimator.
Ridge Regression is the estimator used in this example.
Each color represents a different feature of the
coefficient vector, and this is displayed as a function of the
regularization parameter.
This example also shows the usefulness of applying Ridge regression to highly ill-conditioned matrices. For such matrices, a slight change in the target variable can cause huge variances in the calculated weights. In such cases, it is useful to set a certain regularization (alpha) to reduce this variation (noise).
When alpha is very large, the regularization effect dominates the squared loss function and the coefficients tend to zero. At the end of the path, as alpha tends toward zero and the solution tends towards the ordinary least squares, coefficients exhibit big oscillations. In practice it is necessary to tune alpha in such a way that a balance is maintained between both.
# Authors: The scikit-learn developers
# SPDX-License-Identifier: BSD-3-Clause

import matplotlib.pyplot as plt
import numpy as np

from sklearn import linear_model

# X is the 10x10 Hilbert matrix
X = 1.0 / (np.arange(1, 11) + np.arange(0, 10)[:, np.newaxis])
y = np.ones(10)
Compute paths#
n_alphas = 200
alphas = np.logspace(-10, -2, n_alphas)

coefs = []
for a in alphas:
    ridge = linear_model.Ridge(alpha=a, fit_intercept=False)
    ridge.fit(X, y)
    coefs.append(ridge.coef_)
Display results#
ax = plt.gca()

ax.plot(alphas, coefs)
ax.set_xscale("log")
ax.set_xlim(ax.get_xlim()[::-1])  # reverse axis
plt.xlabel("alpha")
plt.ylabel("weights")
plt.title("Ridge Coefficients vs Regularization Strength (alpha)")
plt.axis("tight")
plt.legend(
    [f"Feature {i + 1}" for i in range(X.shape[1])], loc="best", fontsize="small"
)
plt.show()
Total running time of the script: (0 minutes 0.350 seconds)
Related examples
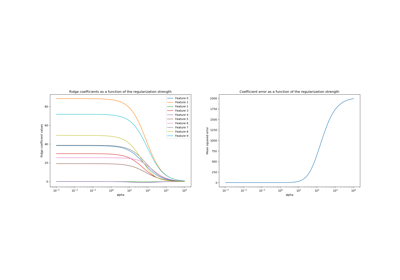
Ridge coefficients as a function of the L2 Regularization
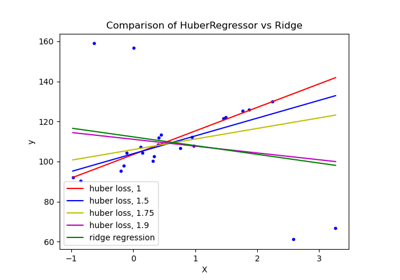
HuberRegressor vs Ridge on dataset with strong outliers
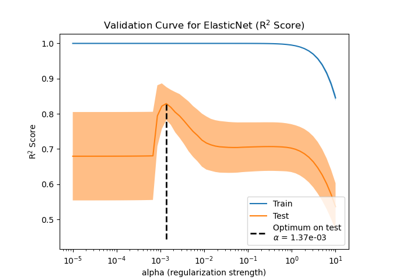
Effect of model regularization on training and test error
Common pitfalls in the interpretation of coefficients of linear models
