Note
Go to the end to download the full example code or to run this example in your browser via JupyterLite or Binder.
Joint feature selection with multi-task Lasso#
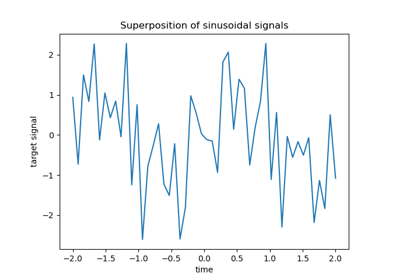
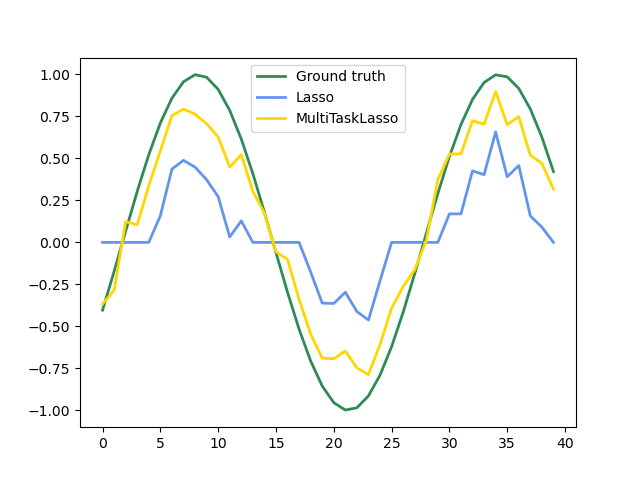
The multi-task lasso allows to fit multiple regression problems jointly enforcing the selected features to be the same across tasks. This example simulates sequential measurements, each task is a time instant, and the relevant features vary in amplitude over time while being the same. The multi-task lasso imposes that features that are selected at one time point are select for all time point. This makes feature selection by the Lasso more stable.
# Authors: The scikit-learn developers
# SPDX-License-Identifier: BSD-3-Clause
Generate data#
import numpy as np

rng = np.random.RandomState(42)

# Generate some 2D coefficients with sine waves with random frequency and phase
n_samples, n_features, n_tasks = 100, 30, 40
n_relevant_features = 5
coef = np.zeros((n_tasks, n_features))
times = np.linspace(0, 2 * np.pi, n_tasks)
for k in range(n_relevant_features):
    coef[:, k] = np.sin((1.0 + rng.randn(1)) * times + 3 * rng.randn(1))

X = rng.randn(n_samples, n_features)
Y = np.dot(X, coef.T) + rng.randn(n_samples, n_tasks)
Fit models#
from sklearn.linear_model import Lasso, MultiTaskLasso

coef_lasso_ = np.array([Lasso(alpha=0.5).fit(X, y).coef_ for y in Y.T])
coef_multi_task_lasso_ = MultiTaskLasso(alpha=1.0).fit(X, Y).coef_
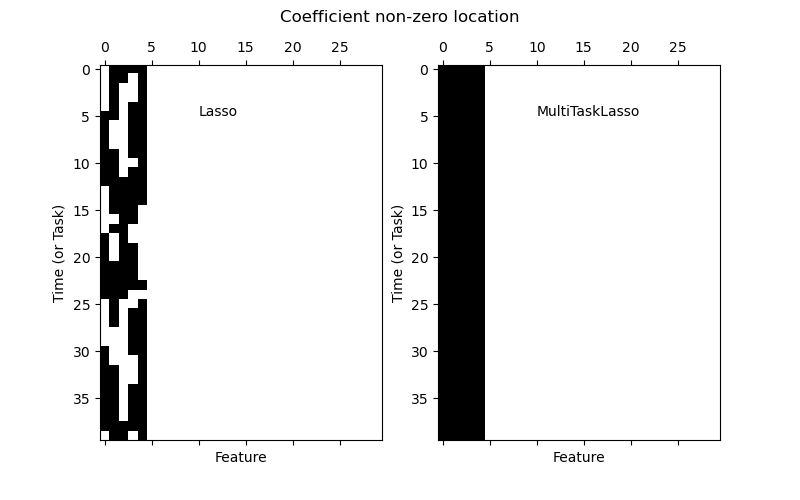
Plot support and time series#
import matplotlib.pyplot as plt

fig = plt.figure(figsize=(8, 5))
plt.subplot(1, 2, 1)
plt.spy(coef_lasso_)
plt.xlabel("Feature")
plt.ylabel("Time (or Task)")
plt.text(10, 5, "Lasso")
plt.subplot(1, 2, 2)
plt.spy(coef_multi_task_lasso_)
plt.xlabel("Feature")
plt.ylabel("Time (or Task)")
plt.text(10, 5, "MultiTaskLasso")
fig.suptitle("Coefficient non-zero location")

feature_to_plot = 0
plt.figure()
lw = 2
plt.plot(coef[:, feature_to_plot], color="seagreen", linewidth=lw, label="Ground truth")
plt.plot(
    coef_lasso_[:, feature_to_plot], color="cornflowerblue", linewidth=lw, label="Lasso"
)
plt.plot(
    coef_multi_task_lasso_[:, feature_to_plot],
    color="gold",
    linewidth=lw,
    label="MultiTaskLasso",
)
plt.legend(loc="upper center")
plt.axis("tight")
plt.ylim([-1.1, 1.1])
plt.show()
Total running time of the script: (0 minutes 0.220 seconds)
Related examples