Note
Go to the end to download the full example code or to run this example in your browser via JupyterLite or Binder.
Multilabel classification using a classifier chain#
This example shows how to use ClassifierChain to solve
a multilabel classification problem.
The most naive strategy to solve such a task is to independently train a binary classifier on each label (i.e. each column of the target variable). At prediction time, the ensemble of binary classifiers is used to assemble multitask prediction.
This strategy does not allow to model relationship between different tasks. The
ClassifierChain is the meta-estimator (i.e. an estimator
taking an inner estimator) that implements a more advanced strategy. The ensemble
of binary classifiers are used as a chain where the prediction of a classifier in the
chain is used as a feature for training the next classifier on a new label. Therefore,
these additional features allow each chain to exploit correlations among labels.
The Jaccard similarity score for chain tends to be greater than that of the set independent base models.
# Authors: The scikit-learn developers
# SPDX-License-Identifier: BSD-3-Clause
Loading a dataset#
For this example, we use the yeast dataset which contains 2,417 datapoints each with 103 features and 14 possible labels. Each data point has at least one label. As a baseline we first train a logistic regression classifier for each of the 14 labels. To evaluate the performance of these classifiers we predict on a held-out test set and calculate the Jaccard similarity for each sample.
import matplotlib.pyplot as plt
import numpy as np

from sklearn.datasets import fetch_openml
from sklearn.model_selection import train_test_split

# Load a multi-label dataset from https://www.openml.org/d/40597
X, Y = fetch_openml("yeast", version=4, return_X_y=True)
Y = Y == "TRUE"
X_train, X_test, Y_train, Y_test = train_test_split(X, Y, test_size=0.2, random_state=0)
Fit models#
We fit LogisticRegression wrapped by
OneVsRestClassifier and ensemble of multiple
ClassifierChain.
LogisticRegression wrapped by OneVsRestClassifier#
Since by default LogisticRegression can’t
handle data with multiple targets, we need to use
OneVsRestClassifier.
After fitting the model we calculate Jaccard similarity.
from sklearn.linear_model import LogisticRegression
from sklearn.metrics import jaccard_score
from sklearn.multiclass import OneVsRestClassifier

base_lr = LogisticRegression()
ovr = OneVsRestClassifier(base_lr)
ovr.fit(X_train, Y_train)
Y_pred_ovr = ovr.predict(X_test)
ovr_jaccard_score = jaccard_score(Y_test, Y_pred_ovr, average="samples")
Chain of binary classifiers#
Because the models in each chain are arranged randomly there is significant variation in performance among the chains. Presumably there is an optimal ordering of the classes in a chain that will yield the best performance. However, we do not know that ordering a priori. Instead, we can build a voting ensemble of classifier chains by averaging the binary predictions of the chains and apply a threshold of 0.5. The Jaccard similarity score of the ensemble is greater than that of the independent models and tends to exceed the score of each chain in the ensemble (although this is not guaranteed with randomly ordered chains).
from sklearn.multioutput import ClassifierChain

chains = [ClassifierChain(base_lr, order="random", random_state=i) for i in range(10)]
for chain in chains:
    chain.fit(X_train, Y_train)

Y_pred_chains = np.array([chain.predict_proba(X_test) for chain in chains])
chain_jaccard_scores = [
    jaccard_score(Y_test, Y_pred_chain >= 0.5, average="samples")
    for Y_pred_chain in Y_pred_chains
]

Y_pred_ensemble = Y_pred_chains.mean(axis=0)
ensemble_jaccard_score = jaccard_score(
    Y_test, Y_pred_ensemble >= 0.5, average="samples"
)
Plot results#
Plot the Jaccard similarity scores for the independent model, each of the chains, and the ensemble (note that the vertical axis on this plot does not begin at 0).
model_scores = [ovr_jaccard_score] + chain_jaccard_scores + [ensemble_jaccard_score]

model_names = (
    "Independent",
    "Chain 1",
    "Chain 2",
    "Chain 3",
    "Chain 4",
    "Chain 5",
    "Chain 6",
    "Chain 7",
    "Chain 8",
    "Chain 9",
    "Chain 10",
    "Ensemble",
)

x_pos = np.arange(len(model_names))

fig, ax = plt.subplots(figsize=(7, 4))
ax.grid(True)
ax.set_title("Classifier Chain Ensemble Performance Comparison")
ax.set_xticks(x_pos)
ax.set_xticklabels(model_names, rotation="vertical")
ax.set_ylabel("Jaccard Similarity Score")
ax.set_ylim([min(model_scores) * 0.9, max(model_scores) * 1.1])
colors = ["r"] + ["b"] * len(chain_jaccard_scores) + ["g"]
ax.bar(x_pos, model_scores, alpha=0.5, color=colors)
plt.tight_layout()
plt.show()
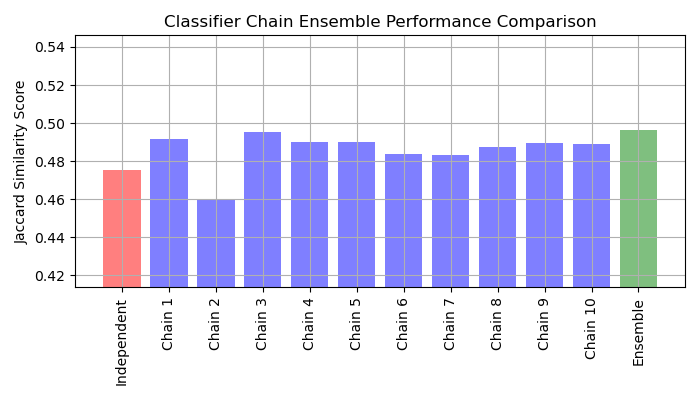
Results interpretation#
There are three main takeaways from this plot:
Independent model wrapped by
OneVsRestClassifierperforms worse than the ensemble of classifier chains and some of individual chains. This is caused by the fact that the logistic regression doesn’t model relationship between the labels.ClassifierChaintakes advantage of correlation among labels but due to random nature of labels ordering, it could yield worse result than an independent model.An ensemble of chains performs better because it not only captures relationship between labels but also does not make strong assumptions about their correct order.
Total running time of the script: (0 minutes 2.411 seconds)
Related examples
Statistical comparison of models using grid search