Note
Go to the end to download the full example code or to run this example in your browser via JupyterLite or Binder.
Plot individual and voting regression predictions#
A voting regressor is an ensemble meta-estimator that fits several base
regressors, each on the whole dataset. Then it averages the individual
predictions to form a final prediction.
We will use three different regressors to predict the data:
GradientBoostingRegressor,
RandomForestRegressor, and
LinearRegression).
Then the above 3 regressors will be used for the
VotingRegressor.
Finally, we will plot the predictions made by all models for comparison.
We will work with the diabetes dataset which consists of 10 features collected from a cohort of diabetes patients. The target is a quantitative measure of disease progression one year after baseline.
# Authors: The scikit-learn developers
# SPDX-License-Identifier: BSD-3-Clause

import matplotlib.pyplot as plt

from sklearn.datasets import load_diabetes
from sklearn.ensemble import (
    GradientBoostingRegressor,
    RandomForestRegressor,
    VotingRegressor,
)
from sklearn.linear_model import LinearRegression
Training classifiers#
First, we will load the diabetes dataset and initiate a gradient boosting regressor, a random forest regressor and a linear regression. Next, we will use the 3 regressors to build the voting regressor:
X, y = load_diabetes(return_X_y=True)

# Train classifiers
reg1 = GradientBoostingRegressor(random_state=1)
reg2 = RandomForestRegressor(random_state=1)
reg3 = LinearRegression()

reg1.fit(X, y)
reg2.fit(X, y)
reg3.fit(X, y)

ereg = VotingRegressor([("gb", reg1), ("rf", reg2), ("lr", reg3)])
ereg.fit(X, y)
VotingRegressor(estimators=[('gb', GradientBoostingRegressor(random_state=1)),
                            ('rf', RandomForestRegressor(random_state=1)),
                            ('lr', LinearRegression())])
In a Jupyter environment, please rerun this cell to show the HTML representation or trust the notebook. On GitHub, the HTML representation is unable to render, please try loading this page with nbviewer.org.
Parameters
Fitted attributes
| Name | Type | Value |
|---|---|---|
|
estimators_
estimators_: list of regressors The collection of fitted sub-estimators as defined in ``estimators`` that are not 'drop'. |
list | [GradientBoost...andom_state=1), RandomForestR...andom_state=1), LinearRegression()] |
|
n_features_in_
n_features_in_: int Number of features seen during :term:`fit`. Only defined if the underlying regressor exposes such an attribute when fit. .. versionadded:: 0.24 |
int | 10 |
|
named_estimators_
named_estimators_: :class:`~sklearn.utils.Bunch` Attribute to access any fitted sub-estimators by name. .. versionadded:: 0.20 |
Bunch | {'gb': Gradie...rRegression()} |
Parameters
Fitted attributes
Parameters
Fitted attributes
Parameters
Fitted attributes
| Name | Type | Value |
|---|---|---|
|
coef_
coef_: array of shape (n_features, ) or (n_targets, n_features) Estimated coefficients for the linear regression problem. If multiple targets are passed during the fit (y 2D), this is a 2D array of shape (n_targets, n_features), while if only one target is passed, this is a 1D array of length n_features. |
ndarray[float64](10,) | [ -10.01,-239.82, 519.85,..., 177.06, 751.27, 67.63] |
|
intercept_
intercept_: float or array of shape (n_targets,) Independent term in the linear model. Set to 0.0 if `fit_intercept = False`. |
float64 | 152.1 |
|
n_features_in_
n_features_in_: int Number of features seen during :term:`fit`. .. versionadded:: 0.24 |
int | 10 |
|
rank_
rank_: int Rank of matrix `X`. Only available when `X` is dense. |
int | 10 |
|
singular_
singular_: array of shape (min(X, y),) Singular values of `X`. Only available when `X` is dense. |
ndarray[float64](10,) | [2.01,1.22,1.1 ,...,0.66,0.28,0.09] |
3 features
| votingregressor_gb |
| votingregressor_rf |
| votingregressor_lr |
Making predictions#
Now we will use each of the regressors to make the 20 first predictions.
xt = X[:20]

pred1 = reg1.predict(xt)
pred2 = reg2.predict(xt)
pred3 = reg3.predict(xt)
pred4 = ereg.predict(xt)
Plot the results#
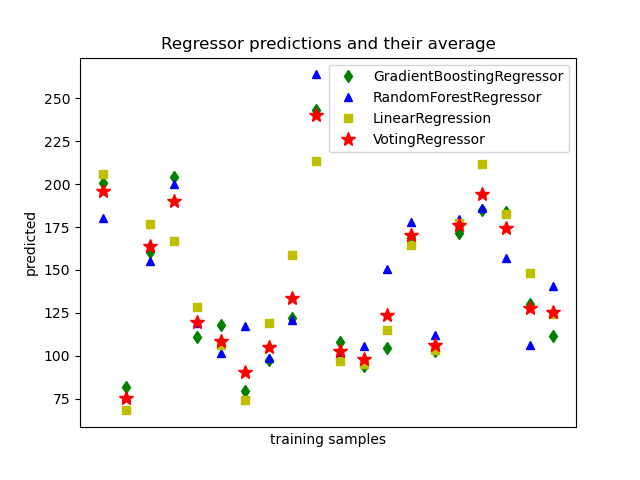
Finally, we will visualize the 20 predictions. The red stars show the average
prediction made by VotingRegressor.
plt.figure()
plt.plot(pred1, "gd", label="GradientBoostingRegressor")
plt.plot(pred2, "b^", label="RandomForestRegressor")
plt.plot(pred3, "ys", label="LinearRegression")
plt.plot(pred4, "r*", ms=10, label="VotingRegressor")

plt.tick_params(axis="x", which="both", bottom=False, top=False, labelbottom=False)
plt.ylabel("predicted")
plt.xlabel("training samples")
plt.legend(loc="best")
plt.title("Regressor predictions and their average")

plt.show()
Total running time of the script: (0 minutes 1.052 seconds)
Related examples
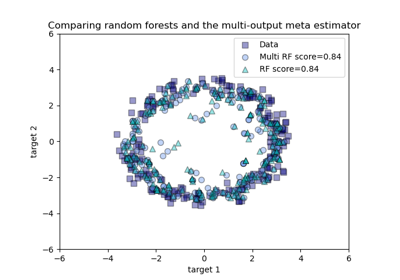
Comparing random forests and the multi-output meta estimator
