average_precision_score#
- sklearn.metrics.average_precision_score(y_true, y_score, *, average='macro', pos_label=1, sample_weight=None)[source]#
Compute average precision (AP) from prediction scores.
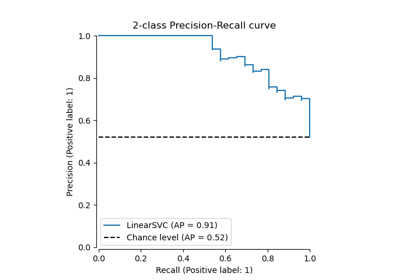
AP summarizes a precision-recall curve as the weighted mean of precisions achieved at each threshold, with the increase in recall from the previous threshold used as the weight:
\[\text{AP} = \sum_n (R_n - R_{n-1}) P_n\]where \(P_n\) and \(R_n\) are the precision and recall at the nth threshold [1]. This implementation is not interpolated and is different from computing the area under the precision-recall curve with the trapezoidal rule, which uses linear interpolation and can be too optimistic.
Read more in the User Guide.
- Parameters:
- y_truearray-like of shape (n_samples,) or (n_samples, n_classes)
True binary labels or binary label indicators.
- y_scorearray-like of shape (n_samples,) or (n_samples, n_classes)
Target scores, can either be probability estimates of the positive class, confidence values, or non-thresholded measure of decisions (as returned by decision_function on some classifiers). For decision_function scores, values greater than or equal to zero should indicate the positive class.
- average{‘micro’, ‘samples’, ‘weighted’, ‘macro’} or None, default=’macro’
If
None, the scores for each class are returned. Otherwise, this determines the type of averaging performed on the data:'micro':Calculate metrics globally by considering each element of the label indicator matrix as a label.
'macro':Calculate metrics for each label, and find their unweighted mean. This does not take label imbalance into account.
'weighted':Calculate metrics for each label, and find their average, weighted by support (the number of true instances for each label).
'samples':Calculate metrics for each instance, and find their average.
Will be ignored when
y_trueis binary.- pos_labelint, float, bool or str, default=1
The label of the positive class. Only applied to binary
y_true. For multilabel-indicatory_true,pos_labelis fixed to 1.- sample_weightarray-like of shape (n_samples,), default=None
Sample weights.
- Returns:
- average_precisionfloat
Average precision score.
See also
roc_auc_scoreCompute the area under the ROC curve.
precision_recall_curveCompute precision-recall pairs for different probability thresholds.
PrecisionRecallDisplay.from_estimatorPlot the precision recall curve using an estimator and data.
PrecisionRecallDisplay.from_predictionsPlot the precision recall curve using true and predicted labels.
Notes
Changed in version 0.19: Instead of linearly interpolating between operating points, precisions are weighted by the change in recall since the last operating point.
References
Examples
>>> import numpy as np
>>> from sklearn.metrics import average_precision_score
>>> y_true = np.array([0, 0, 1, 1])
>>> y_scores = np.array([0.1, 0.4, 0.35, 0.8])
>>> average_precision_score(y_true, y_scores)
0.83
>>> y_true = np.array([0, 0, 1, 1, 2, 2])
>>> y_scores = np.array([
...     [0.7, 0.2, 0.1],
...     [0.4, 0.3, 0.3],
...     [0.1, 0.8, 0.1],
...     [0.2, 0.3, 0.5],
...     [0.4, 0.4, 0.2],
...     [0.1, 0.2, 0.7],
... ])
>>> average_precision_score(y_true, y_scores)
0.77
