ConfusionMatrixDisplay#
- class sklearn.metrics.ConfusionMatrixDisplay(confusion_matrix, *, display_labels=None)[source]#
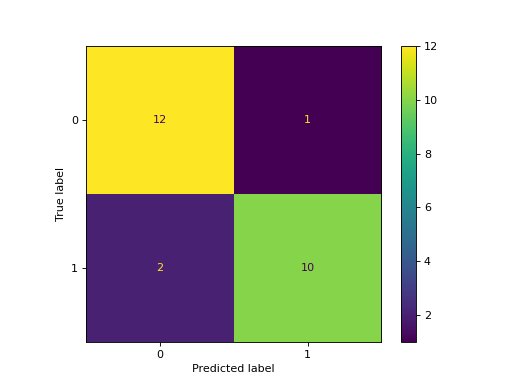
Confusion Matrix visualization.
It is recommend to use
from_estimatororfrom_predictionsto create aConfusionMatrixDisplay. All parameters are stored as attributes.Read more in the User Guide.
- Parameters:
- confusion_matrixndarray of shape (n_classes, n_classes)
Confusion matrix.
- display_labelsndarray of shape (n_classes,), default=None
Display labels for plot. If None, display labels are set from 0 to
n_classes - 1.
- Attributes:
- im_matplotlib AxesImage
Image representing the confusion matrix.
- text_ndarray of shape (n_classes, n_classes), dtype=matplotlib Text, or None
Array of matplotlib axes.
Noneifinclude_valuesis false.- ax_matplotlib Axes
Axes with confusion matrix.
- figure_matplotlib Figure
Figure containing the confusion matrix.
See also
confusion_matrixCompute Confusion Matrix to evaluate the accuracy of a classification.
ConfusionMatrixDisplay.from_estimatorPlot the confusion matrix given an estimator, the data, and the label.
ConfusionMatrixDisplay.from_predictionsPlot the confusion matrix given the true and predicted labels.
Examples
>>> import matplotlib.pyplot as plt
>>> from sklearn.datasets import make_classification
>>> from sklearn.metrics import confusion_matrix, ConfusionMatrixDisplay
>>> from sklearn.model_selection import train_test_split
>>> from sklearn.svm import SVC
>>> X, y = make_classification(random_state=0)
>>> X_train, X_test, y_train, y_test = train_test_split(X, y,
...                                                     random_state=0)
>>> clf = SVC(random_state=0)
>>> clf.fit(X_train, y_train)
SVC(random_state=0)
>>> predictions = clf.predict(X_test)
>>> cm = confusion_matrix(y_test, predictions, labels=clf.classes_)
>>> disp = ConfusionMatrixDisplay(confusion_matrix=cm,
...                               display_labels=clf.classes_)
>>> disp.plot()
<...>
>>> plt.show()
- classmethod from_estimator(estimator, X, y, *, labels=None, sample_weight=None, normalize=None, display_labels=None, include_values=True, xticks_rotation='horizontal', values_format=None, cmap='viridis', ax=None, colorbar=True, im_kw=None, text_kw=None)[source]#
Plot Confusion Matrix given an estimator and some data.
Read more in the User Guide.
Added in version 1.0.
- Parameters:
- estimatorestimator instance
Fitted classifier or a fitted
Pipelinein which the last estimator is a classifier.- X{array-like, sparse matrix} of shape (n_samples, n_features)
Input values.
- yarray-like of shape (n_samples,)
Target values.
- labelsarray-like of shape (n_classes,), default=None
List of labels to index the confusion matrix. This may be used to reorder or select a subset of labels. If
Noneis given, those that appear at least once iny_trueory_predare used in sorted order.- sample_weightarray-like of shape (n_samples,), default=None
Sample weights.
- normalize{‘true’, ‘pred’, ‘all’}, default=None
Either to normalize the counts display in the matrix:
if
'true', the confusion matrix is normalized over the true conditions (e.g. rows);if
'pred', the confusion matrix is normalized over the predicted conditions (e.g. columns);if
'all', the confusion matrix is normalized by the total number of samples;if
None(default), the confusion matrix will not be normalized.
- display_labelsarray-like of shape (n_classes,), default=None
Target names used for plotting. By default,
labelswill be used if it is defined, otherwise the unique labels ofy_trueandy_predwill be used.- include_valuesbool, default=True
Includes values in confusion matrix.
- xticks_rotation{‘vertical’, ‘horizontal’} or float, default=’horizontal’
Rotation of xtick labels.
- values_formatstr, default=None
Format specification for values in confusion matrix. If
None, the format specification is ‘d’ or ‘.2g’ whichever is shorter.- cmapstr or matplotlib Colormap, default=’viridis’
Colormap recognized by matplotlib.
- axmatplotlib Axes, default=None
Axes object to plot on. If
None, a new figure and axes is created.- colorbarbool, default=True
Whether or not to add a colorbar to the plot.
- im_kwdict, default=None
Dict with keywords passed to
matplotlib.pyplot.imshowcall.- text_kwdict, default=None
Dict with keywords passed to
matplotlib.pyplot.textcall.Added in version 1.2.
- Returns:
- display
ConfusionMatrixDisplay
- display
See also
ConfusionMatrixDisplay.from_predictionsPlot the confusion matrix given the true and predicted labels.
Examples
>>> import matplotlib.pyplot as plt
>>> from sklearn.datasets import make_classification
>>> from sklearn.metrics import ConfusionMatrixDisplay
>>> from sklearn.model_selection import train_test_split
>>> from sklearn.svm import SVC
>>> X, y = make_classification(random_state=0)
>>> X_train, X_test, y_train, y_test = train_test_split(
...         X, y, random_state=0)
>>> clf = SVC(random_state=0)
>>> clf.fit(X_train, y_train)
SVC(random_state=0)
>>> ConfusionMatrixDisplay.from_estimator(
...     clf, X_test, y_test)
<...>
>>> plt.show()

- classmethod from_predictions(y_true, y_pred, *, labels=None, sample_weight=None, normalize=None, display_labels=None, include_values=True, xticks_rotation='horizontal', values_format=None, cmap='viridis', ax=None, colorbar=True, im_kw=None, text_kw=None)[source]#
Plot Confusion Matrix given true and predicted labels.
Read more in the User Guide.
Added in version 1.0.
- Parameters:
- y_truearray-like of shape (n_samples,)
True labels.
- y_predarray-like of shape (n_samples,)
The predicted labels given by the method
predictof an classifier.- labelsarray-like of shape (n_classes,), default=None
List of labels to index the confusion matrix. This may be used to reorder or select a subset of labels. If
Noneis given, those that appear at least once iny_trueory_predare used in sorted order.- sample_weightarray-like of shape (n_samples,), default=None
Sample weights.
- normalize{‘true’, ‘pred’, ‘all’}, default=None
Either to normalize the counts display in the matrix:
if
'true', the confusion matrix is normalized over the true conditions (e.g. rows);if
'pred', the confusion matrix is normalized over the predicted conditions (e.g. columns);if
'all', the confusion matrix is normalized by the total number of samples;if
None(default), the confusion matrix will not be normalized.
- display_labelsarray-like of shape (n_classes,), default=None
Target names used for plotting. By default,
labelswill be used if it is defined, otherwise the unique labels ofy_trueandy_predwill be used.- include_valuesbool, default=True
Includes values in confusion matrix.
- xticks_rotation{‘vertical’, ‘horizontal’} or float, default=’horizontal’
Rotation of xtick labels.
- values_formatstr, default=None
Format specification for values in confusion matrix. If
None, the format specification is ‘d’ or ‘.2g’ whichever is shorter.- cmapstr or matplotlib Colormap, default=’viridis’
Colormap recognized by matplotlib.
- axmatplotlib Axes, default=None
Axes object to plot on. If
None, a new figure and axes is created.- colorbarbool, default=True
Whether or not to add a colorbar to the plot.
- im_kwdict, default=None
Dict with keywords passed to
matplotlib.pyplot.imshowcall.- text_kwdict, default=None
Dict with keywords passed to
matplotlib.pyplot.textcall.Added in version 1.2.
- Returns:
- display
ConfusionMatrixDisplay
- display
See also
ConfusionMatrixDisplay.from_estimatorPlot the confusion matrix given an estimator, the data, and the label.
Examples
>>> import matplotlib.pyplot as plt
>>> from sklearn.datasets import make_classification
>>> from sklearn.metrics import ConfusionMatrixDisplay
>>> from sklearn.model_selection import train_test_split
>>> from sklearn.svm import SVC
>>> X, y = make_classification(random_state=0)
>>> X_train, X_test, y_train, y_test = train_test_split(
...         X, y, random_state=0)
>>> clf = SVC(random_state=0)
>>> clf.fit(X_train, y_train)
SVC(random_state=0)
>>> y_pred = clf.predict(X_test)
>>> ConfusionMatrixDisplay.from_predictions(
...    y_test, y_pred)
<...>
>>> plt.show()

- plot(*, include_values=True, cmap='viridis', xticks_rotation='horizontal', values_format=None, ax=None, colorbar=True, im_kw=None, text_kw=None)[source]#
Plot visualization.
- Parameters:
- include_valuesbool, default=True
Includes values in confusion matrix.
- cmapstr or matplotlib Colormap, default=’viridis’
Colormap recognized by matplotlib.
- xticks_rotation{‘vertical’, ‘horizontal’} or float, default=’horizontal’
Rotation of xtick labels.
- values_formatstr, default=None
Format specification for values in confusion matrix. If
None, the format specification is ‘d’ or ‘.2g’ whichever is shorter.- axmatplotlib axes, default=None
Axes object to plot on. If
None, a new figure and axes is created.- colorbarbool, default=True
Whether or not to add a colorbar to the plot.
- im_kwdict, default=None
Dict with keywords passed to
matplotlib.pyplot.imshowcall.- text_kwdict, default=None
Dict with keywords passed to
matplotlib.pyplot.textcall.Added in version 1.2.
- Returns:
- display
ConfusionMatrixDisplay Returns a
ConfusionMatrixDisplayinstance that contains all the information to plot the confusion matrix.
- display
Gallery examples#
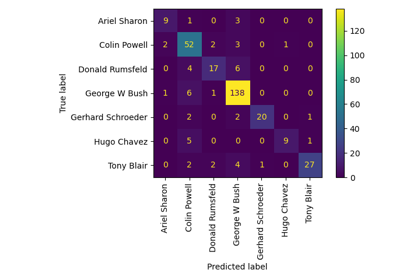
Faces recognition example using eigenfaces and SVMs
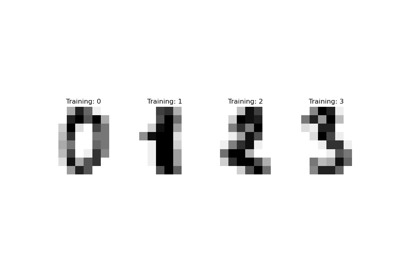
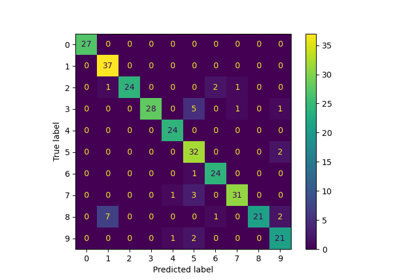
Label Propagation digits: Demonstrating performance
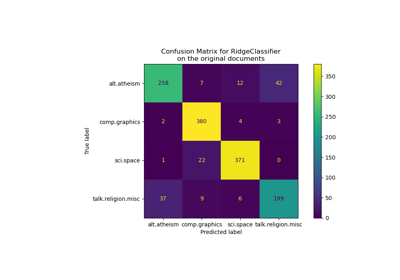
Classification of text documents using sparse features