fetch_species_distributions#
- sklearn.datasets.fetch_species_distributions(*, data_home=None, download_if_missing=True, n_retries=3, delay=1.0)[source]#
Loader for species distribution dataset from Phillips et. al. (2006).
Read more in the User Guide.
- Parameters:
- data_homestr or path-like, default=None
Specify another download and cache folder for the datasets. By default all scikit-learn data is stored in ‘~/scikit_learn_data’ subfolders.
- download_if_missingbool, default=True
If False, raise an OSError if the data is not locally available instead of trying to download the data from the source site.
- n_retriesint, default=3
Number of retries when HTTP errors are encountered.
Added in version 1.5.
- delayfloat, default=1.0
Number of seconds between retries.
Added in version 1.5.
- Returns:
- data
Bunch Dictionary-like object, with the following attributes.
- coveragesarray, shape = [14, 1592, 1212]
These represent the 14 features measured at each point of the map grid. The latitude/longitude values for the grid are discussed below. Missing data is represented by the value -9999.
- trainrecord array, shape = (1624,)
The training points for the data. Each point has three fields:
train[‘species’] is the species name
train[‘dd long’] is the longitude, in degrees
train[‘dd lat’] is the latitude, in degrees
- testrecord array, shape = (620,)
The test points for the data. Same format as the training data.
- Nx, Nyintegers
The number of longitudes (x) and latitudes (y) in the grid
- x_left_lower_corner, y_left_lower_cornerfloats
The (x,y) position of the lower-left corner, in degrees
- grid_sizefloat
The spacing between points of the grid, in degrees
- data
Notes
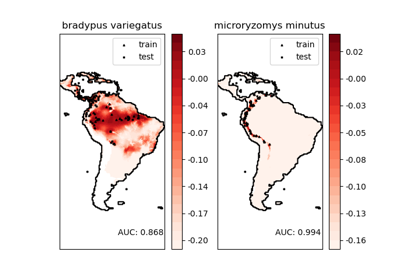
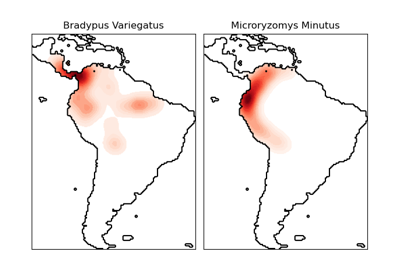
This dataset represents the geographic distribution of species. The dataset is provided by Phillips et. al. (2006).
The two species are:
“Bradypus variegatus” , the Brown-throated Sloth.
“Microryzomys minutus” , also known as the Forest Small Rice Rat, a rodent that lives in Peru, Colombia, Ecuador, Peru, and Venezuela.
References
“Maximum entropy modeling of species geographic distributions” S. J. Phillips, R. P. Anderson, R. E. Schapire - Ecological Modelling, 190:231-259, 2006.
Examples
>>> from sklearn.datasets import fetch_species_distributions
>>> species = fetch_species_distributions()
>>> species.train[:5]
array([(b'microryzomys_minutus', -64.7   , -17.85  ),
       (b'microryzomys_minutus', -67.8333, -16.3333),
       (b'microryzomys_minutus', -67.8833, -16.3   ),
       (b'microryzomys_minutus', -67.8   , -16.2667),
       (b'microryzomys_minutus', -67.9833, -15.9   )],
      dtype=[('species', 'S22'), ('dd long', '<f4'), ('dd lat', '<f4')])
For a more extended example, see Species distribution modeling