make_blobs#
- sklearn.datasets.make_blobs(n_samples=100, n_features=2, *, centers=None, cluster_std=1.0, center_box=(-10.0, 10.0), shuffle=True, random_state=None, return_centers=False)[source]#
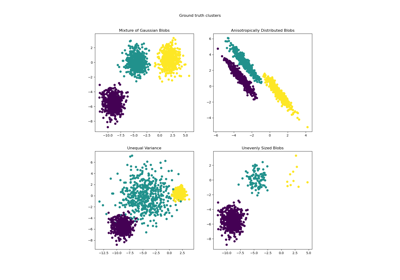
Generate isotropic Gaussian blobs for clustering.
Read more in the User Guide.
- Parameters:
- n_samplesint or array-like, default=100
If int, it is the total number of points equally divided among clusters. If array-like, each element of the sequence indicates the number of samples per cluster.
Changed in version v0.20: one can now pass an array-like to the
n_samplesparameter- n_featuresint, default=2
The number of features for each sample.
- centersint or array-like of shape (n_centers, n_features), default=None
The number of centers to generate, or the fixed center locations. If n_samples is an int and centers is None, 3 centers are generated. If n_samples is array-like, centers must be either None or an array of length equal to the length of n_samples.
- cluster_stdfloat or array-like of float, default=1.0
The standard deviation of the clusters.
- center_boxtuple of float (min, max), default=(-10.0, 10.0)
The bounding box for each cluster center when centers are generated at random.
- shufflebool, default=True
Shuffle the samples.
- random_stateint, RandomState instance or None, default=None
Determines random number generation for dataset creation. Pass an int for reproducible output across multiple function calls. See Glossary.
- return_centersbool, default=False
If True, then return the centers of each cluster.
Added in version 0.23.
- Returns:
- Xndarray of shape (n_samples, n_features)
The generated samples.
- yndarray of shape (n_samples,)
The integer labels for cluster membership of each sample.
- centersndarray of shape (n_centers, n_features)
The centers of each cluster. Only returned if
return_centers=True.
See also
make_classificationA more intricate variant.
Examples
>>> from sklearn.datasets import make_blobs
>>> X, y = make_blobs(n_samples=10, centers=3, n_features=2,
...                   random_state=0)
>>> print(X.shape)
(10, 2)
>>> y
array([0, 0, 1, 0, 2, 2, 2, 1, 1, 0])
>>> X, y = make_blobs(n_samples=[3, 3, 4], centers=None, n_features=2,
...                   random_state=0)
>>> print(X.shape)
(10, 2)
>>> y
array([0, 1, 2, 0, 2, 2, 2, 1, 1, 0])
Gallery examples#
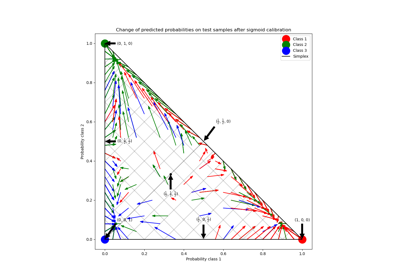
Probability Calibration for 3-class classification
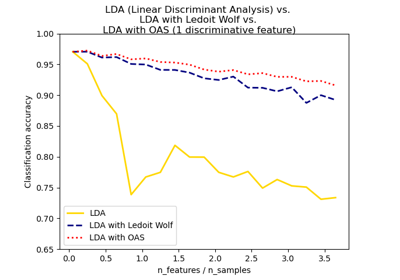
Normal, Ledoit-Wolf and OAS Linear Discriminant Analysis for classification
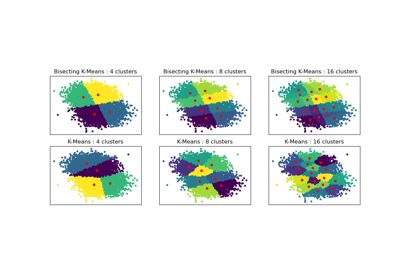
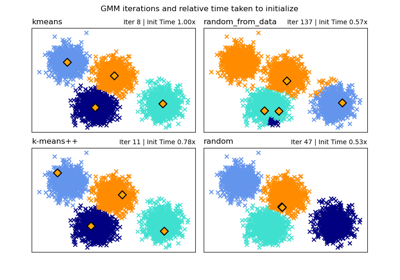
Bisecting K-Means and Regular K-Means Performance Comparison
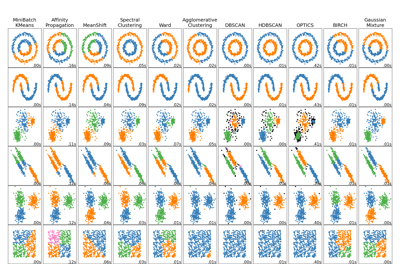
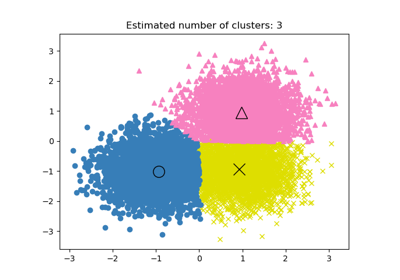
Comparing different clustering algorithms on toy datasets
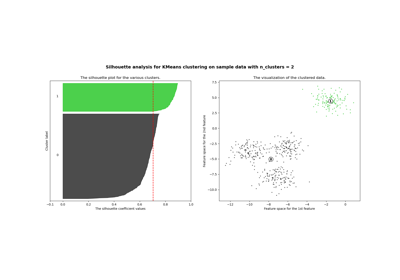
Selecting the number of clusters with silhouette analysis on KMeans clustering
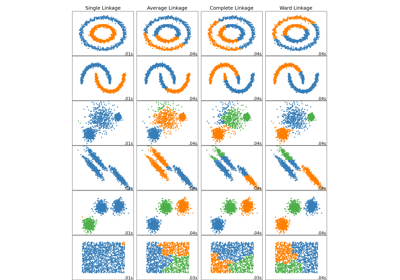
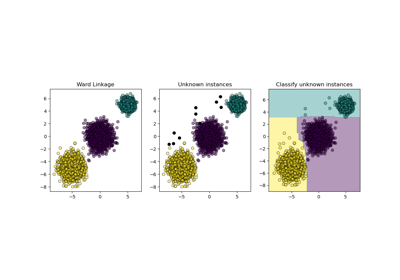
Comparing different hierarchical linkage methods on toy datasets
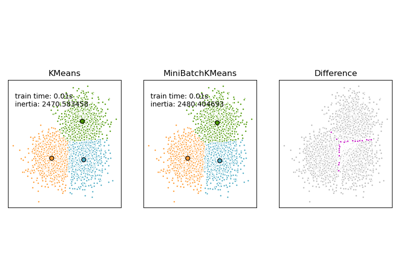
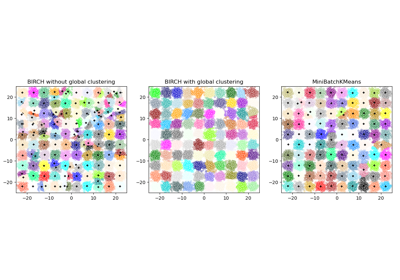
Comparison of the K-Means and MiniBatchKMeans clustering algorithms
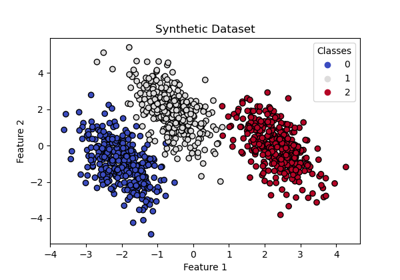
Decision Boundaries of Multinomial and One-vs-Rest Logistic Regression
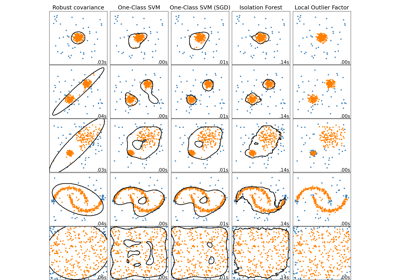
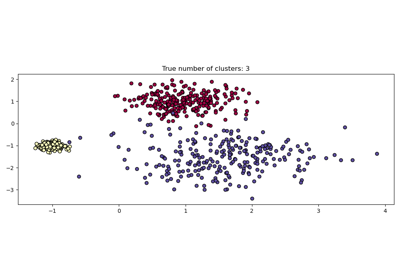
Comparing anomaly detection algorithms for outlier detection on toy datasets
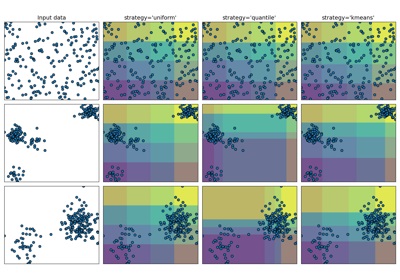
Demonstrating the different strategies of KBinsDiscretizer