confusion_matrix#
- sklearn.metrics.confusion_matrix(y_true, y_pred, *, labels=None, sample_weight=None, normalize=None)[source]#
Compute confusion matrix to evaluate the accuracy of a classification.
By definition a confusion matrix \(C\) is such that \(C_{i, j}\) is equal to the number of observations known to be in group \(i\) and predicted to be in group \(j\).
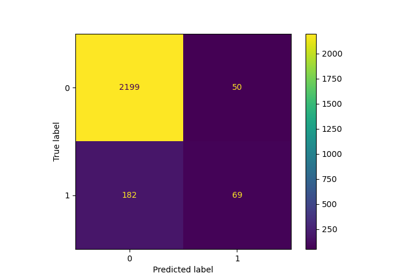
Thus in binary classification, the count of true negatives is \(C_{0,0}\), false negatives is \(C_{1,0}\), true positives is \(C_{1,1}\) and false positives is \(C_{0,1}\).
Read more in the User Guide.
- Parameters:
- y_truearray-like of shape (n_samples,)
Ground truth (correct) target values.
- y_predarray-like of shape (n_samples,)
Estimated targets as returned by a classifier.
- labelsarray-like of shape (n_classes,), default=None
List of labels to index the matrix. This may be used to reorder or select a subset of labels. If
Noneis given, those that appear at least once iny_trueory_predare used in sorted order.- sample_weightarray-like of shape (n_samples,), default=None
Sample weights.
Added in version 0.18.
- normalize{‘true’, ‘pred’, ‘all’}, default=None
Normalizes confusion matrix over the true (rows), predicted (columns) conditions or all the population. If None, confusion matrix will not be normalized.
- Returns:
- Cndarray of shape (n_classes, n_classes)
Confusion matrix whose i-th row and j-th column entry indicates the number of samples with true label being i-th class and predicted label being j-th class.
See also
ConfusionMatrixDisplay.from_estimatorPlot the confusion matrix given an estimator, the data, and the label.
ConfusionMatrixDisplay.from_predictionsPlot the confusion matrix given the true and predicted labels.
ConfusionMatrixDisplayConfusion Matrix visualization.
confusion_matrix_at_thresholdsFor binary classification, compute true negative, false positive, false negative and true positive counts per threshold.
References
[1]Wikipedia entry for the Confusion matrix (Wikipedia and other references may use a different convention for axes).
Examples
>>> from sklearn.metrics import confusion_matrix
>>> y_true = [2, 0, 2, 2, 0, 1]
>>> y_pred = [0, 0, 2, 2, 0, 2]
>>> confusion_matrix(y_true, y_pred)
array([[2, 0, 0],
       [0, 0, 1],
       [1, 0, 2]])
>>> y_true = ["cat", "ant", "cat", "cat", "ant", "bird"]
>>> y_pred = ["ant", "ant", "cat", "cat", "ant", "cat"]
>>> confusion_matrix(y_true, y_pred, labels=["ant", "bird", "cat"])
array([[2, 0, 0],
       [0, 0, 1],
       [1, 0, 2]])
In the binary case, we can extract true positives, etc. as follows:
>>> tn, fp, fn, tp = confusion_matrix([0, 1, 0, 1], [1, 1, 1, 0]).ravel().tolist()
>>> (tn, fp, fn, tp)
(0, 2, 1, 1)
Gallery examples#
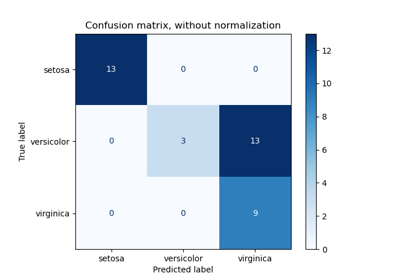
Evaluate the performance of a classifier with Confusion Matrix
Post-tuning the decision threshold for cost-sensitive learning