roc_curve#
- sklearn.metrics.roc_curve(y_true, y_score, *, pos_label=None, sample_weight=None, drop_intermediate=True)[source]#
Compute Receiver operating characteristic (ROC).
Note: Support beyond binary classification tasks, via one-vs-rest or one-vs-one, is not implemented.
Read more in the User Guide.
- Parameters:
- y_truearray-like of shape (n_samples,)
True binary labels. If labels are not either {-1, 1} or {0, 1}, then pos_label should be explicitly given.
- y_scorearray-like of shape (n_samples,)
Target scores, can either be probability estimates of the positive class, confidence values, or non-thresholded measure of decisions (as returned by “decision_function” on some classifiers). For decision_function scores, values greater than or equal to zero should indicate the positive class.
- pos_labelint, float, bool or str, default=None
The label of the positive class. When
pos_label=None, ify_trueis in {-1, 1} or {0, 1},pos_labelis set to 1, otherwise an error will be raised.- sample_weightarray-like of shape (n_samples,), default=None
Sample weights.
- drop_intermediatebool, default=True
Whether to drop thresholds where the resulting point is collinear with its neighbors in ROC space. This has no effect on the ROC AUC or visual shape of the curve, but reduces the number of plotted points.
Added in version 0.17: parameter drop_intermediate.
- Returns:
- fprndarray of shape (>2,)
Increasing false positive rates such that element
iis the false positive rate of predictions with score >=thresholds[i].- tprndarray of shape (>2,)
Increasing true positive rates such that element
iis the true positive rate of predictions with score >=thresholds[i].- thresholdsndarray of shape (n_thresholds,)
Decreasing thresholds on the decision function used to compute fpr and tpr. The first threshold is set to
np.inf.Changed in version 1.3: An arbitrary threshold at infinity (stored in
thresholds[0]) is added to represent a classifier that always predicts the negative class, i.e.fpr=0andtpr=0.
See also
RocCurveDisplay.from_estimatorPlot Receiver Operating Characteristic (ROC) curve given an estimator and some data.
RocCurveDisplay.from_predictionsPlot Receiver Operating Characteristic (ROC) curve given the true and predicted values.
RocCurveDisplay.from_cv_resultsPlot multi-fold ROC curves given cross-validation results.
det_curveCompute error rates for different probability thresholds.
roc_auc_scoreCompute the area under the ROC curve.
confusion_matrix_at_thresholdsFor binary classification, compute true negative, false positive, false negative and true positive counts per threshold.
Notes
Since the thresholds are sorted from low to high values, they are reversed upon returning them to ensure they correspond to both
fprandtpr, which are sorted in reversed order during their calculation.References
[2]Fawcett T. An introduction to ROC analysis[J]. Pattern Recognition Letters, 2006, 27(8):861-874.
Examples
>>> import numpy as np
>>> from sklearn import metrics
>>> y = np.array([1, 1, 2, 2])
>>> scores = np.array([0.1, 0.4, 0.35, 0.8])
>>> fpr, tpr, thresholds = metrics.roc_curve(y, scores, pos_label=2)
>>> fpr
array([0. , 0. , 0.5, 0.5, 1. ])
>>> tpr
array([0. , 0.5, 0.5, 1. , 1. ])
>>> thresholds
array([ inf, 0.8 , 0.4 , 0.35, 0.1 ])
Gallery examples#
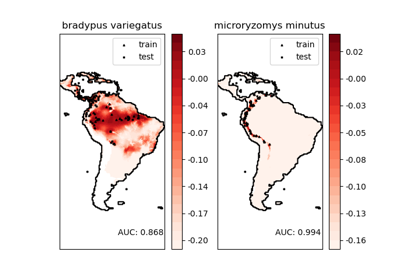
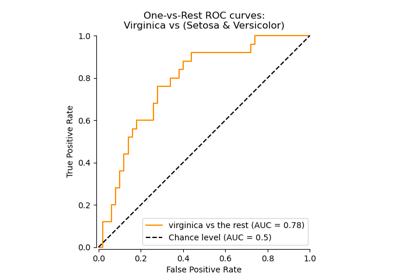
Multiclass Receiver Operating Characteristic (ROC)