Examples
Release Highlights
These examples illustrate the main features of the releases of scikit-learn.

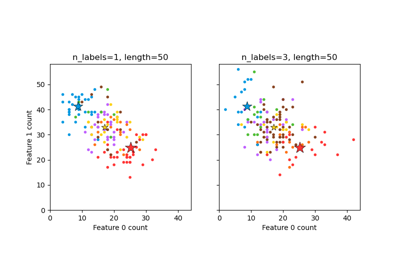
Biclustering
Examples concerning biclustering techniques.
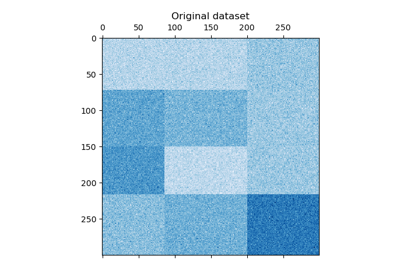
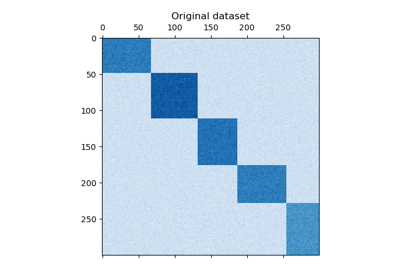

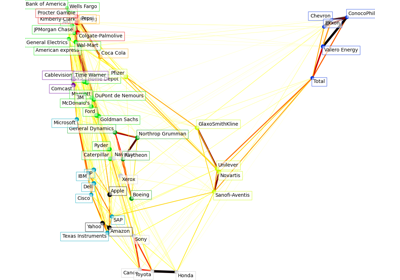
Biclustering documents with the Spectral Co-clustering algorithm
Calibration
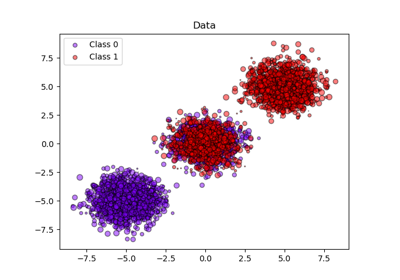
Examples illustrating the calibration of predicted probabilities of classifiers.
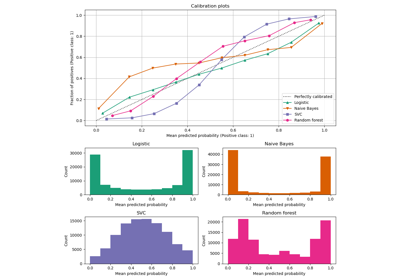
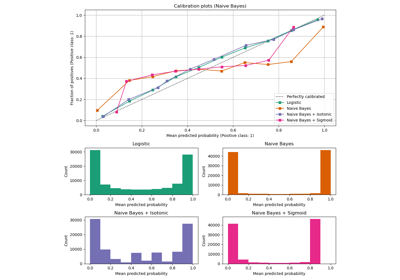
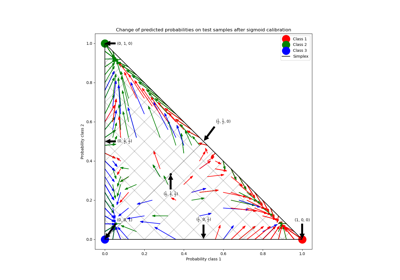
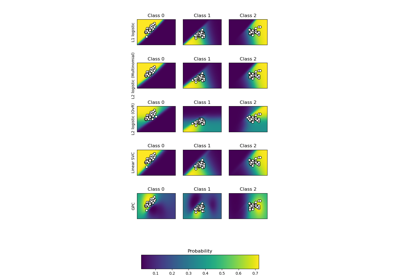
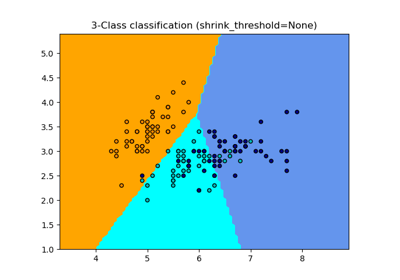
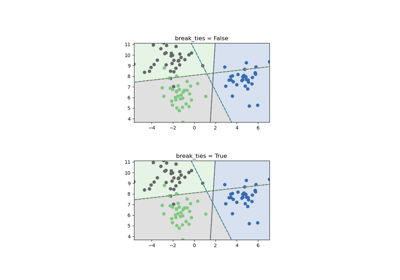
Probability Calibration for 3-class classification
Classification
General examples about classification algorithms.
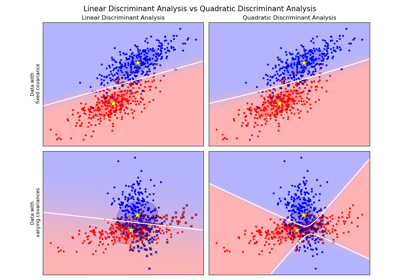
Linear and Quadratic Discriminant Analysis with covariance ellipsoid
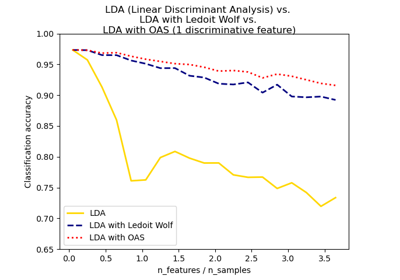
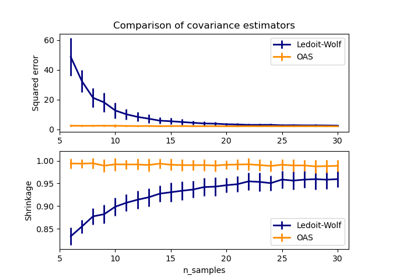
Normal, Ledoit-Wolf and OAS Linear Discriminant Analysis for classification

Clustering
Examples concerning the sklearn.cluster module.
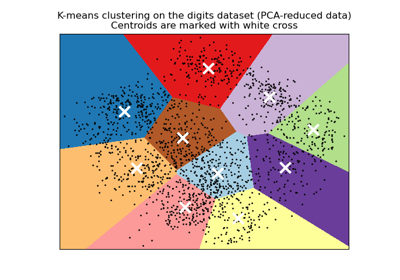
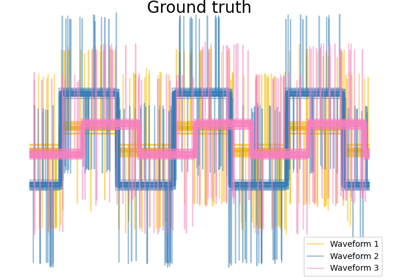
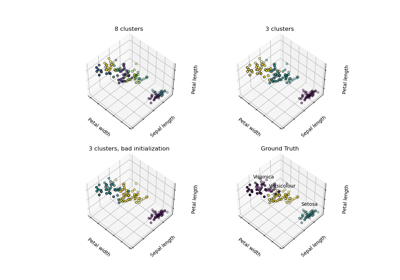
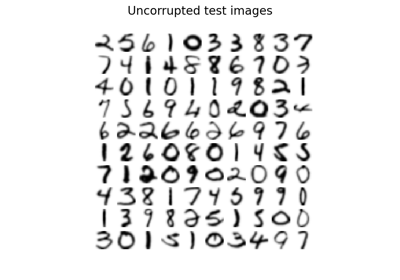
A demo of K-Means clustering on the handwritten digits data
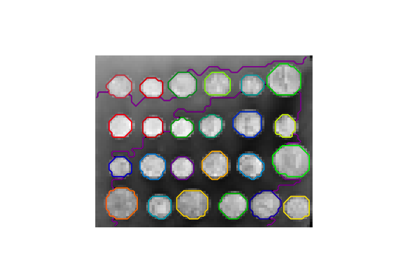
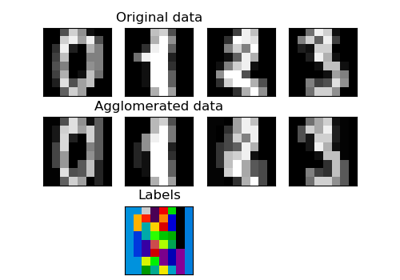
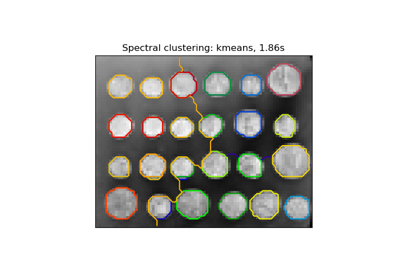
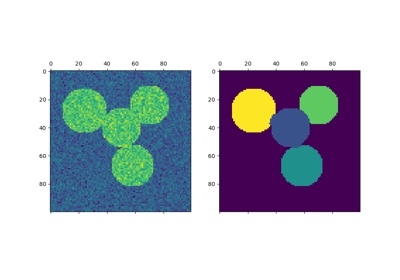
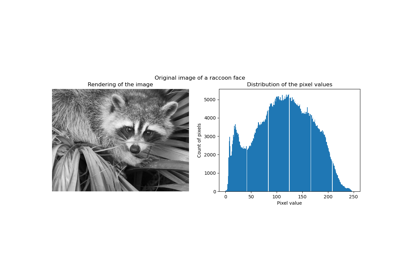
A demo of structured Ward hierarchical clustering on an image of coins
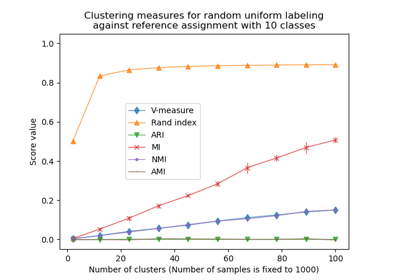
Adjustment for chance in clustering performance evaluation
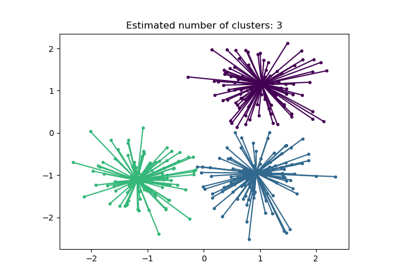
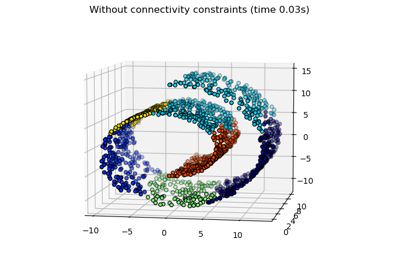
Agglomerative clustering with and without structure
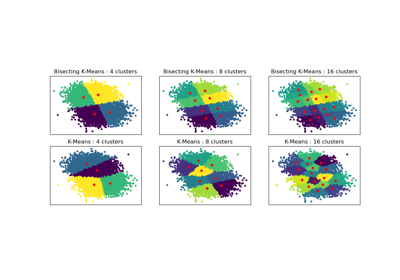
Bisecting K-Means and Regular K-Means Performance Comparison

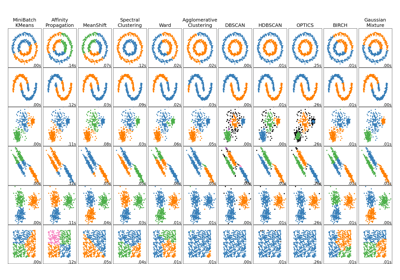
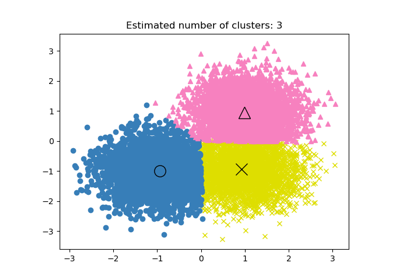
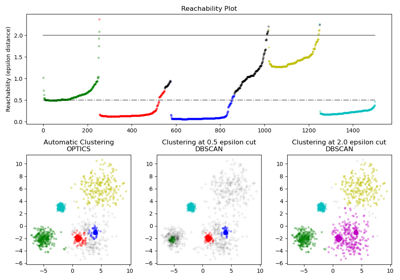
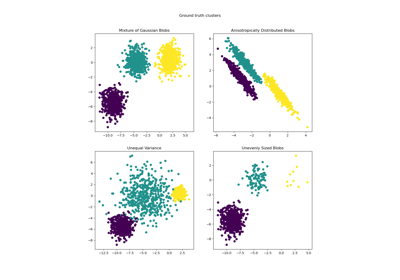
Comparing different clustering algorithms on toy datasets
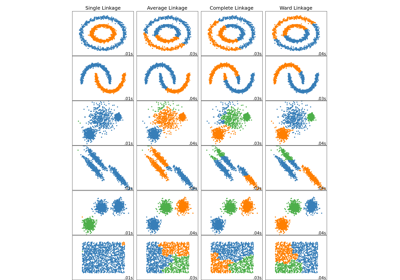
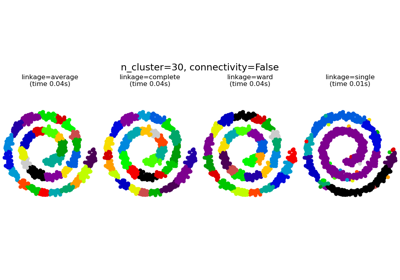
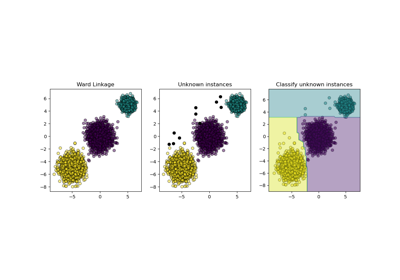
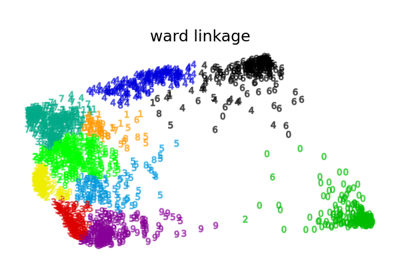
Comparing different hierarchical linkage methods on toy datasets
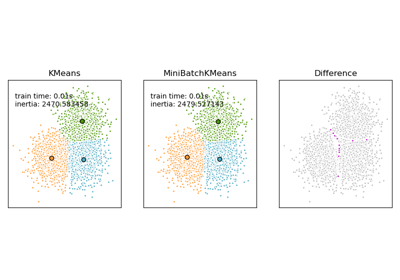
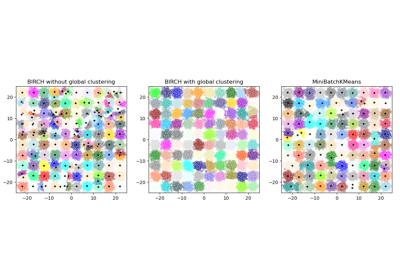
Comparison of the K-Means and MiniBatchKMeans clustering algorithms

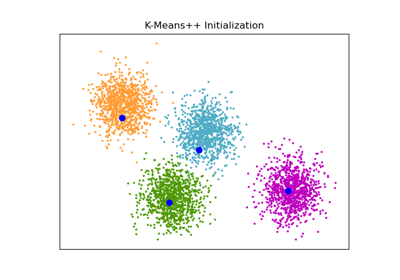
Empirical evaluation of the impact of k-means initialization
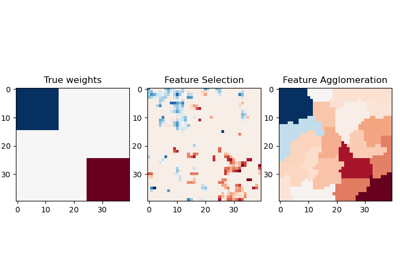
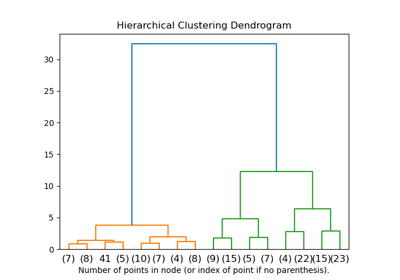
Hierarchical clustering: structured vs unstructured ward
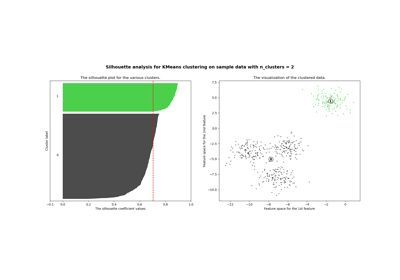
Selecting the number of clusters with silhouette analysis on KMeans clustering
Various Agglomerative Clustering on a 2D embedding of digits
Covariance estimation
Examples concerning the sklearn.covariance module.
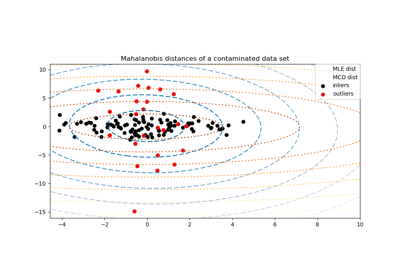
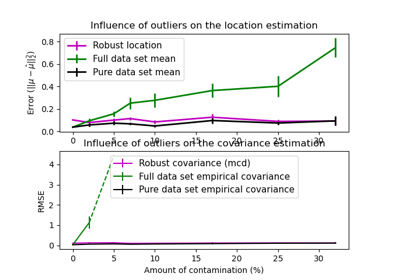
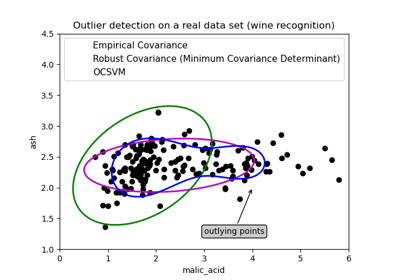
Robust covariance estimation and Mahalanobis distances relevance
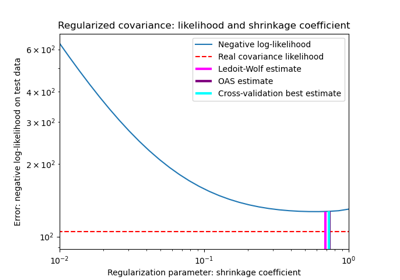
Shrinkage covariance estimation: LedoitWolf vs OAS and max-likelihood
Cross decomposition
Examples concerning the sklearn.cross_decomposition module.
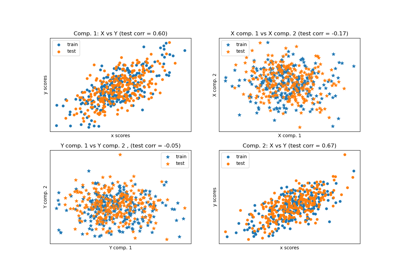
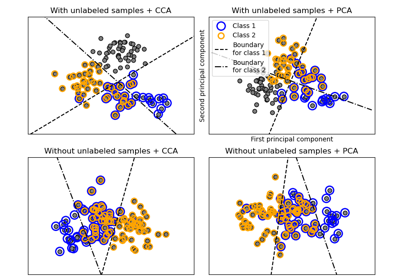
Principal Component Regression vs Partial Least Squares Regression
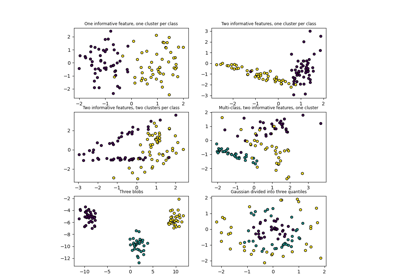
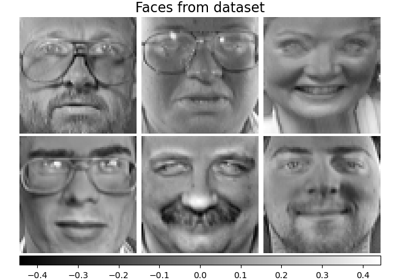
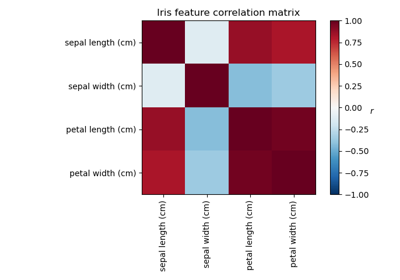
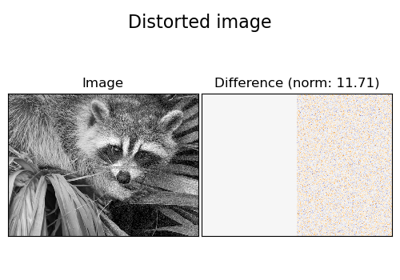
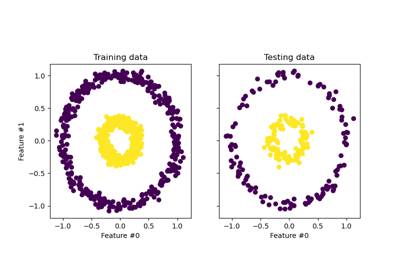
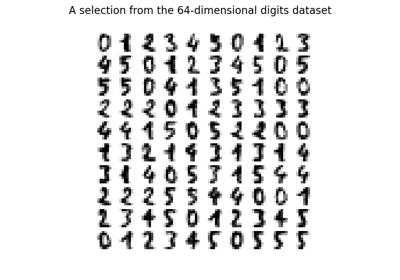
Dataset examples
Examples concerning the sklearn.datasets module.
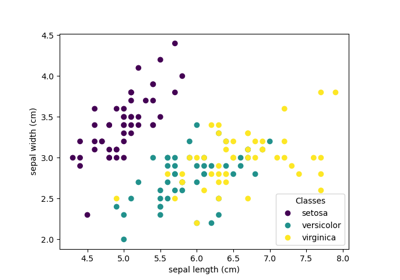
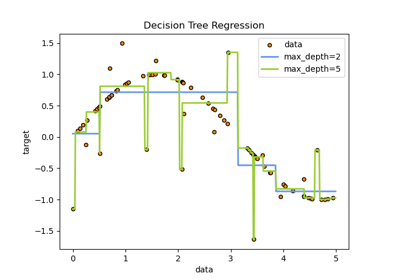
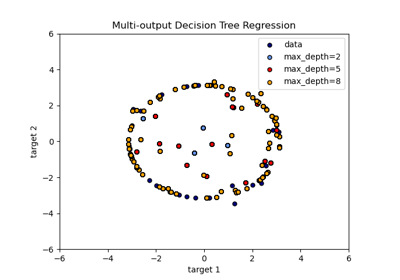
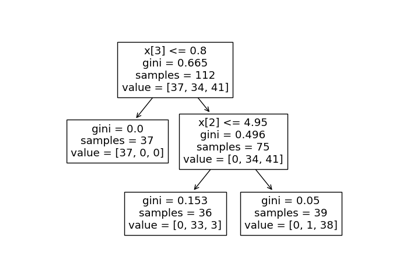
Decision Trees
Examples concerning the sklearn.tree module.
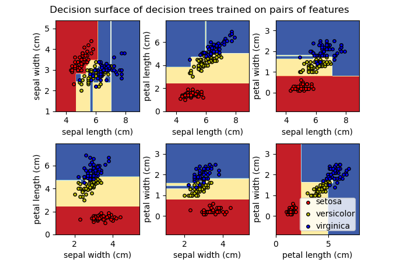
Plot the decision surface of decision trees trained on the iris dataset
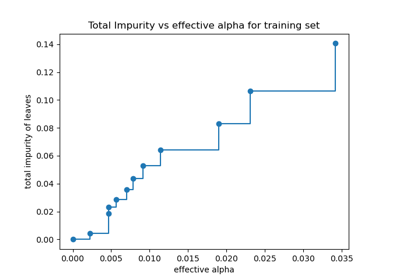
Post pruning decision trees with cost complexity pruning
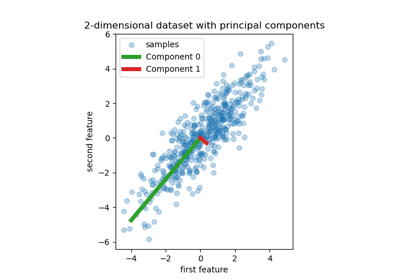
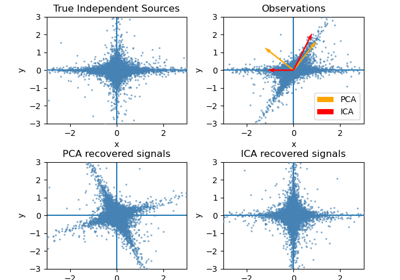
Decomposition
Examples concerning the sklearn.decomposition module.
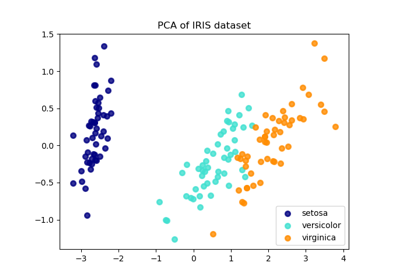
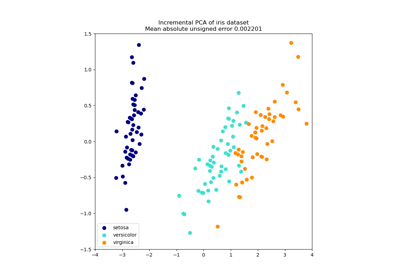
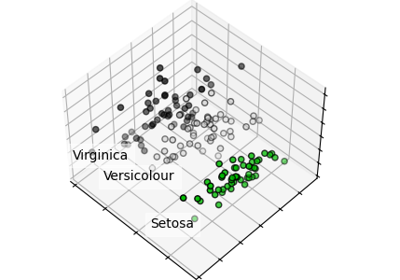
Comparison of LDA and PCA 2D projection of Iris dataset
Factor Analysis (with rotation) to visualize patterns
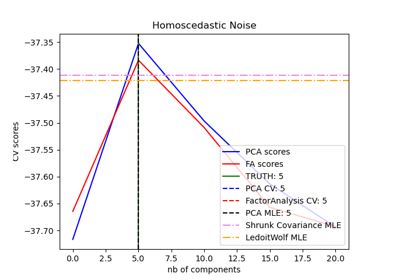
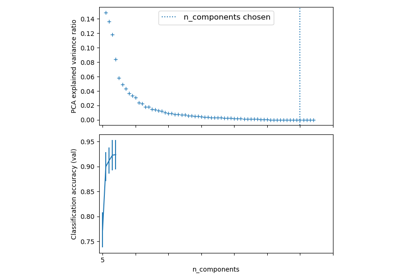
Model selection with Probabilistic PCA and Factor Analysis (FA)
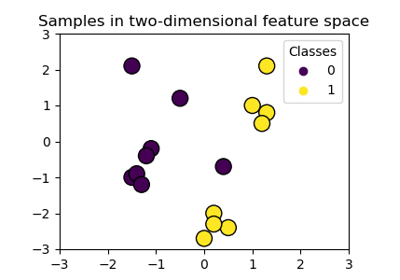
Developing Estimators
Examples concerning the development of Custom Estimator.

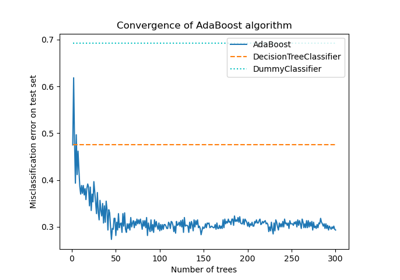
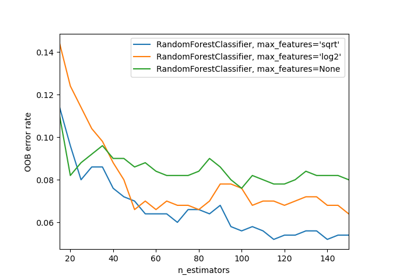
Ensemble methods
Examples concerning the sklearn.ensemble module.
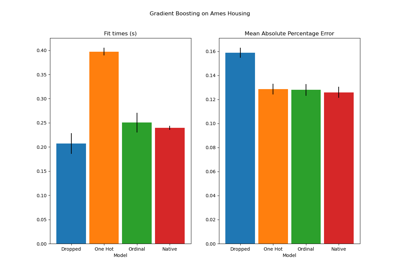

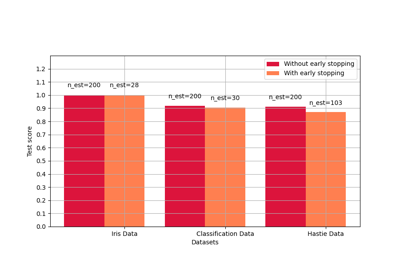
Comparing Random Forests and Histogram Gradient Boosting models
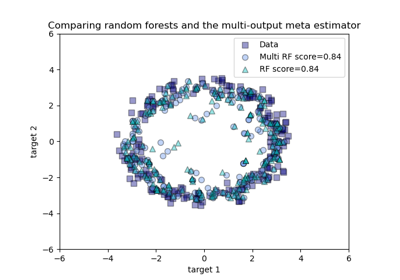
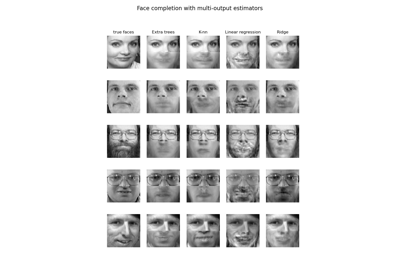
Comparing random forests and the multi-output meta estimator
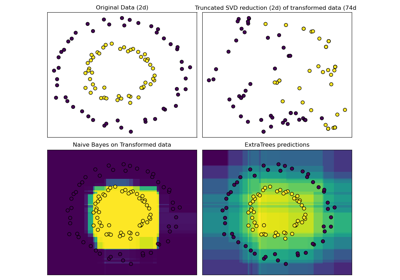
Hashing feature transformation using Totally Random Trees
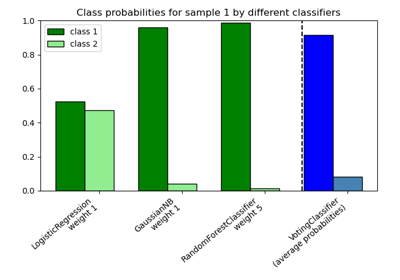
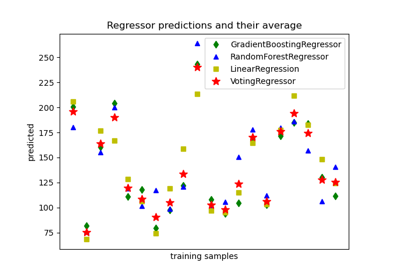
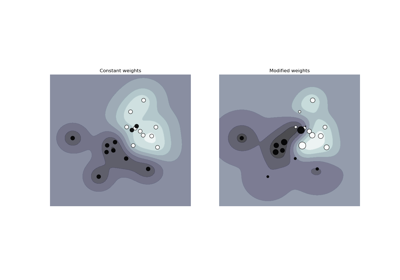
Plot class probabilities calculated by the VotingClassifier
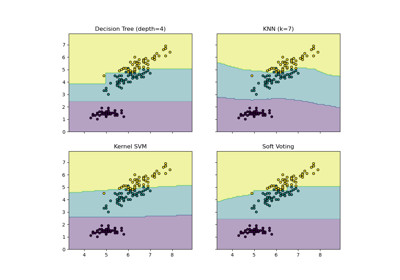
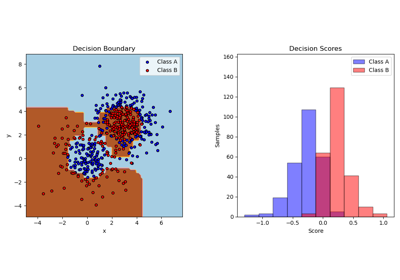
Plot the decision boundaries of a VotingClassifier
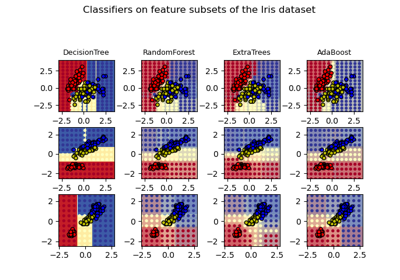
Plot the decision surfaces of ensembles of trees on the iris dataset
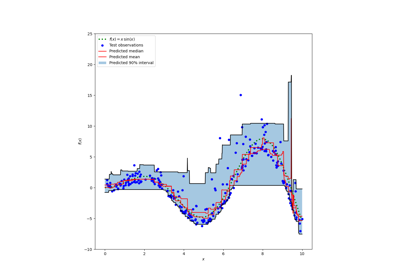
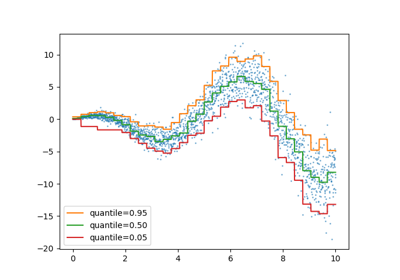
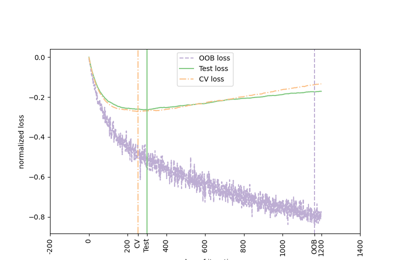
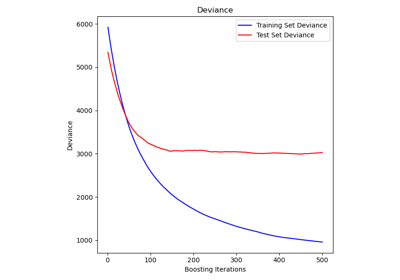
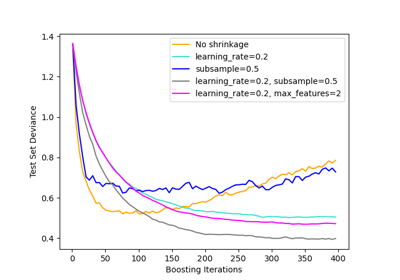
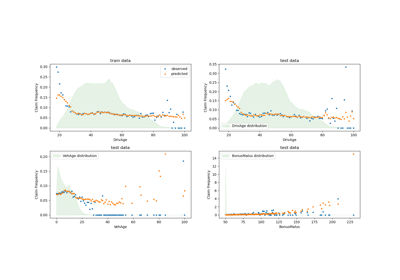
Prediction Intervals for Gradient Boosting Regression
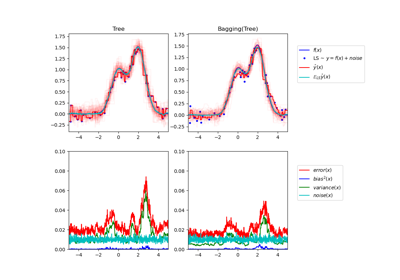
Single estimator versus bagging: bias-variance decomposition
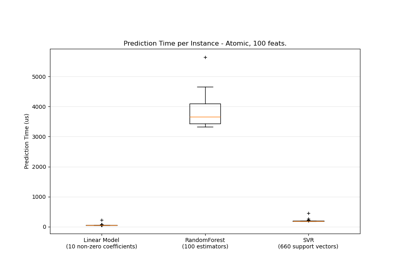
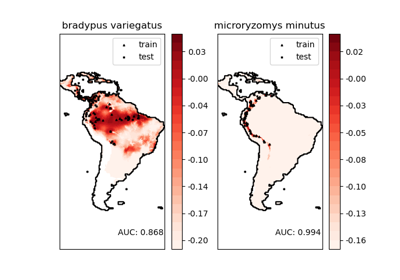
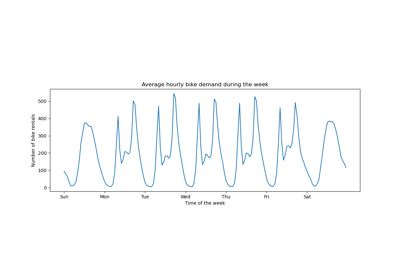
Examples based on real world datasets
Applications to real world problems with some medium sized datasets or interactive user interface.
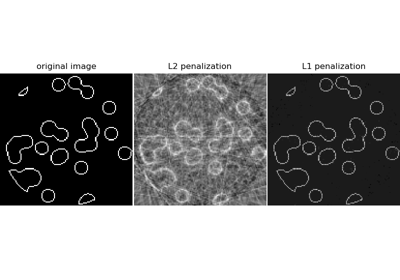
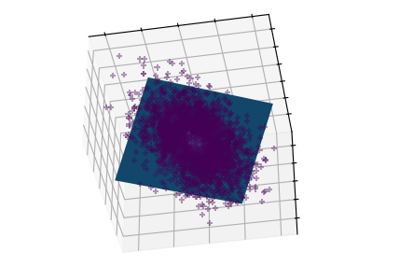
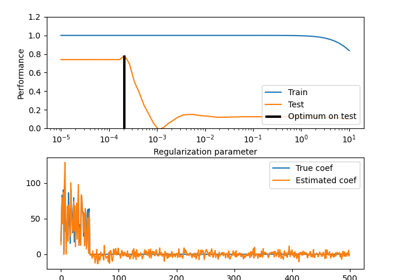
Compressive sensing: tomography reconstruction with L1 prior (Lasso)
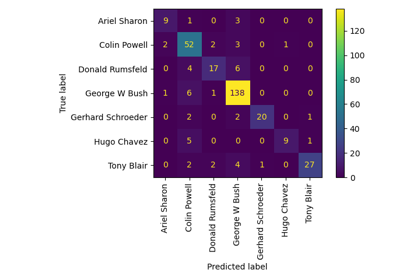
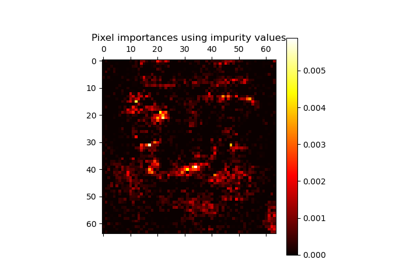
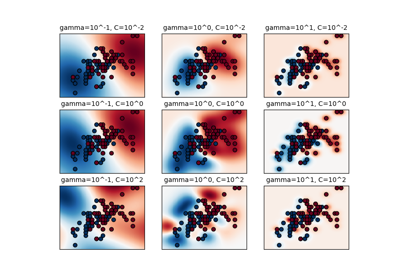
Faces recognition example using eigenfaces and SVMs

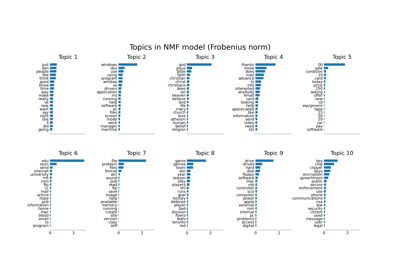
Topic extraction with Non-negative Matrix Factorization and Latent Dirichlet Allocation

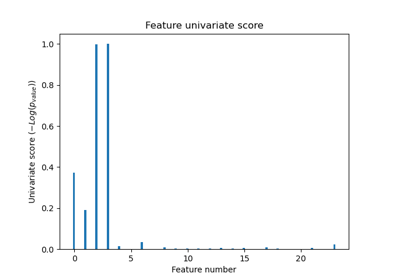
Feature Selection
Examples concerning the sklearn.feature_selection module.

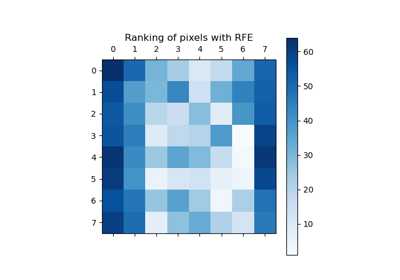
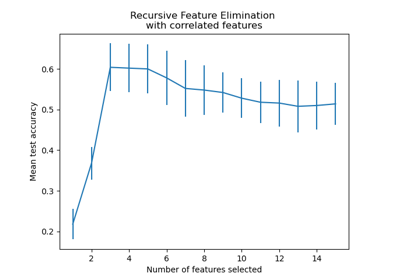
Recursive feature elimination with cross-validation
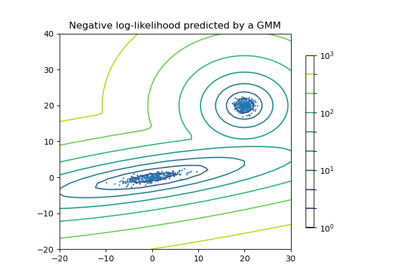
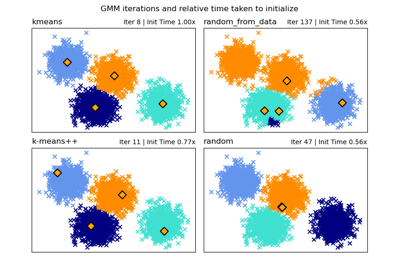
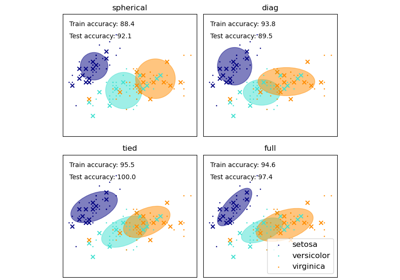
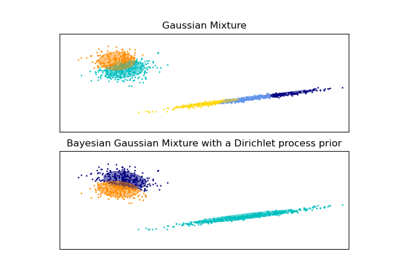
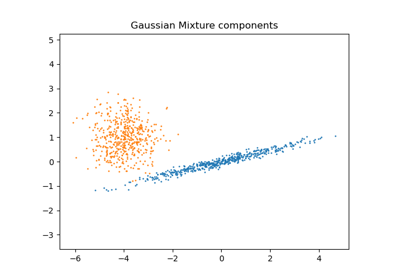
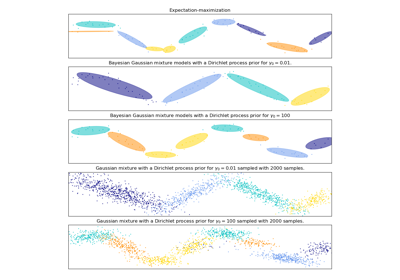
Gaussian Mixture Models
Examples concerning the sklearn.mixture module.
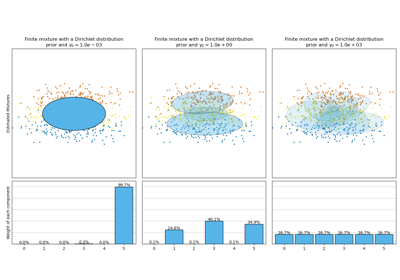
Concentration Prior Type Analysis of Variation Bayesian Gaussian Mixture
Gaussian Process for Machine Learning
Examples concerning the sklearn.gaussian_process module.
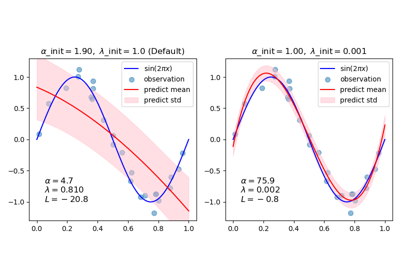
Ability of Gaussian process regression (GPR) to estimate data noise-level
Comparison of kernel ridge and Gaussian process regression
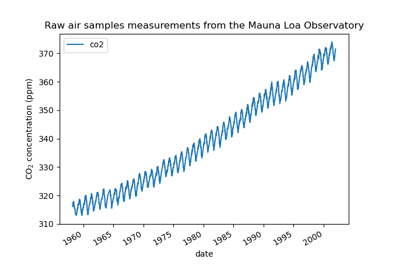
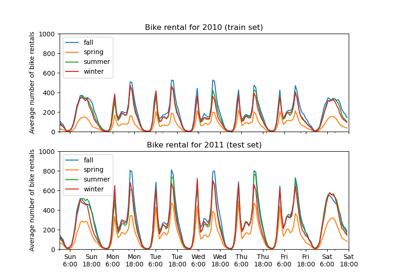
Forecasting of CO2 level on Mona Loa dataset using Gaussian process regression (GPR)
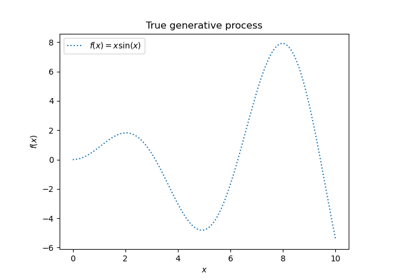
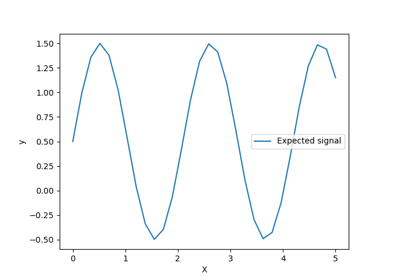
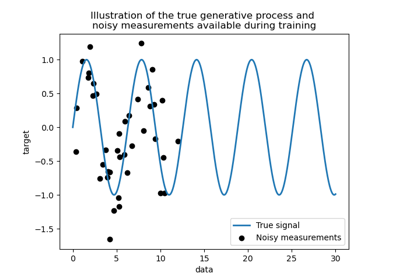
Gaussian Processes regression: basic introductory example
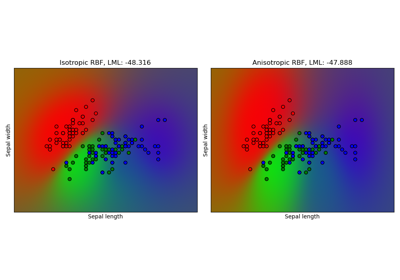
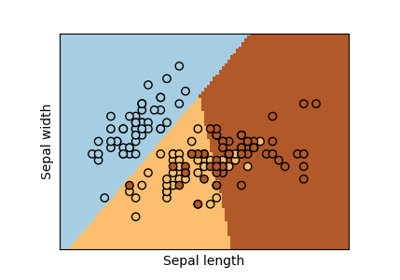
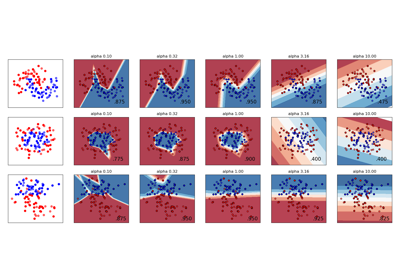
Gaussian process classification (GPC) on iris dataset
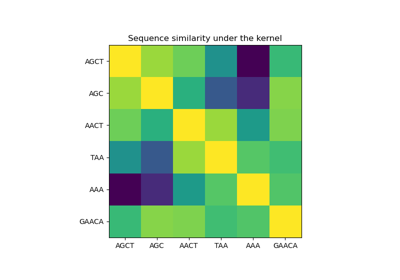
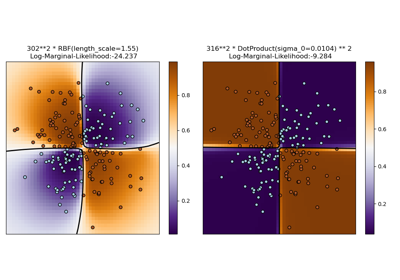
Illustration of Gaussian process classification (GPC) on the XOR dataset
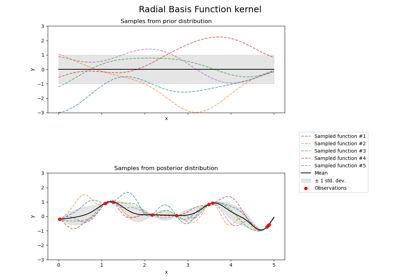
Illustration of prior and posterior Gaussian process for different kernels
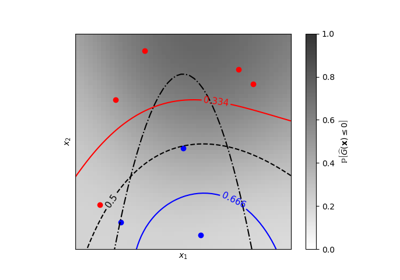
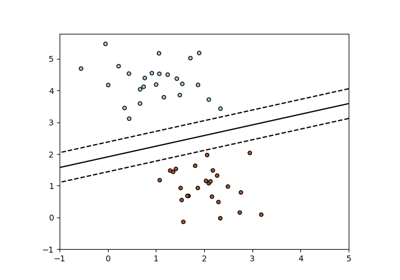
Iso-probability lines for Gaussian Processes classification (GPC)
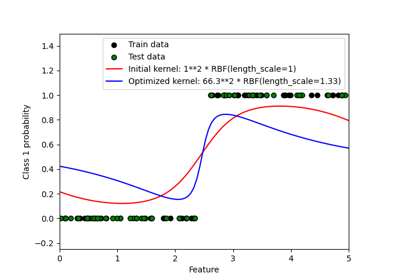
Probabilistic predictions with Gaussian process classification (GPC)
Generalized Linear Models
Examples concerning the sklearn.linear_model module.

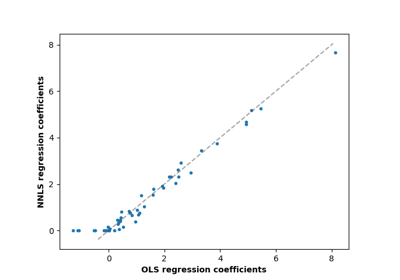
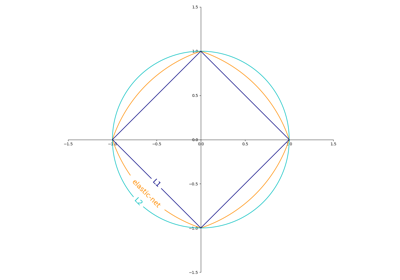
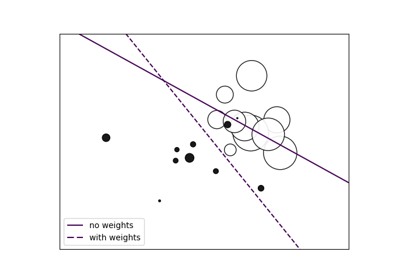
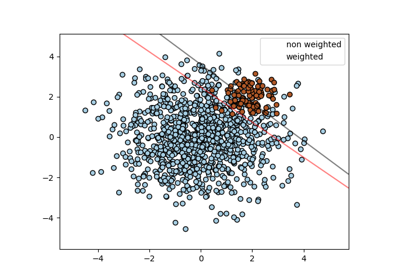
Fitting an Elastic Net with a precomputed Gram Matrix and Weighted Samples
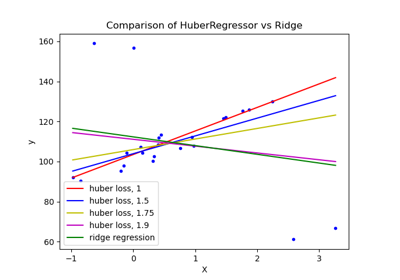
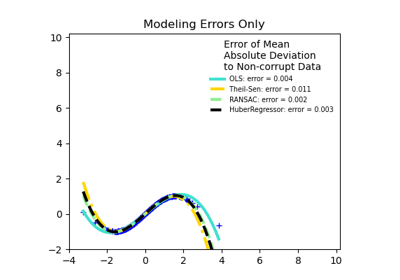
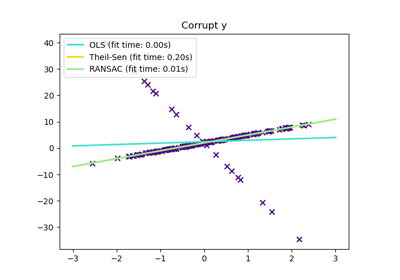
HuberRegressor vs Ridge on dataset with strong outliers
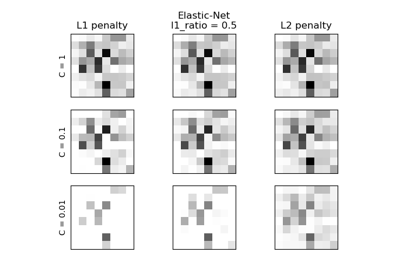

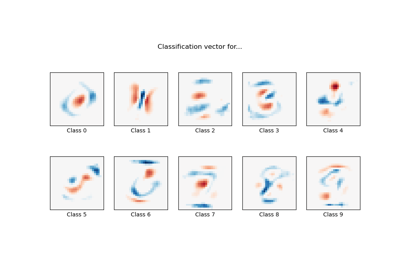
MNIST classification using multinomial logistic + L1
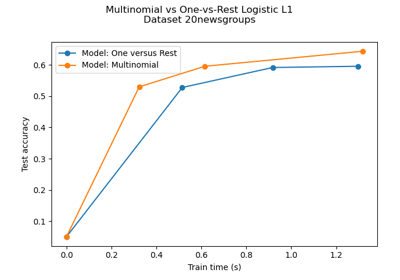
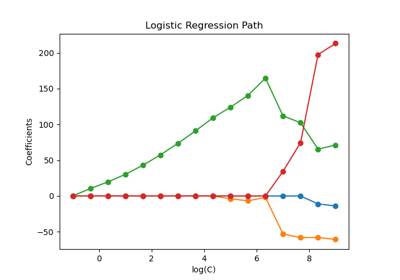
Multiclass sparse logistic regression on 20newgroups
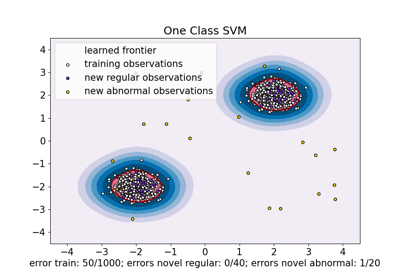
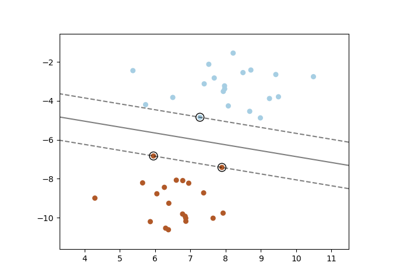
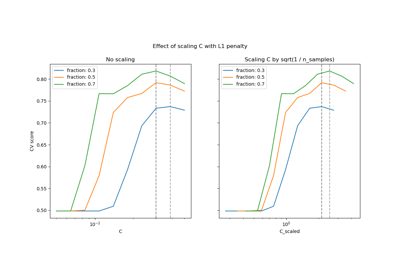
One-Class SVM versus One-Class SVM using Stochastic Gradient Descent
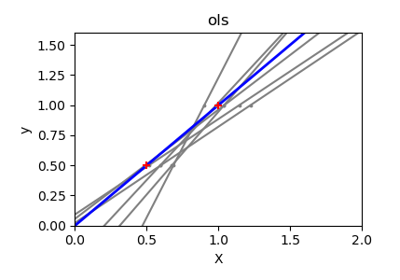
Ordinary Least Squares and Ridge Regression Variance
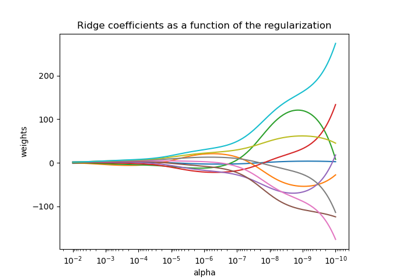
Plot Ridge coefficients as a function of the regularization
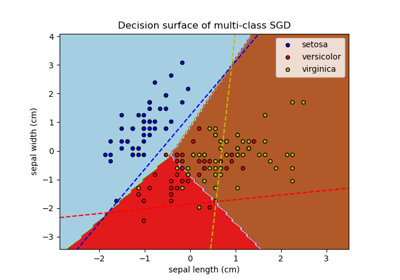
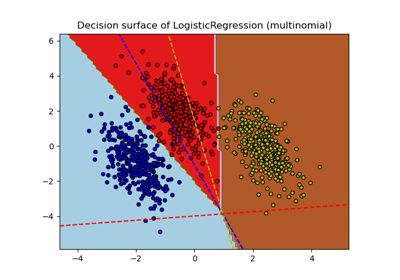
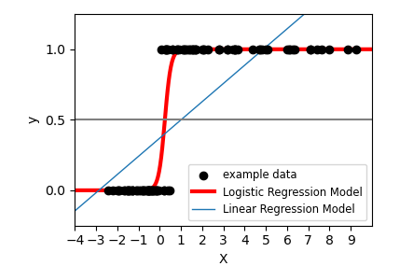
Plot multinomial and One-vs-Rest Logistic Regression
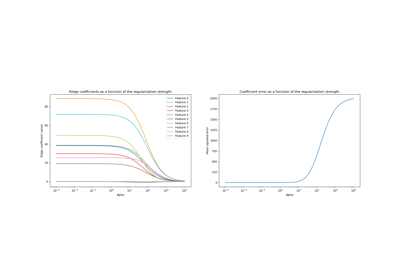
Ridge coefficients as a function of the L2 Regularization
Inspection
Examples related to the sklearn.inspection module.
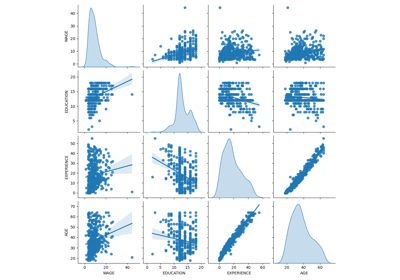
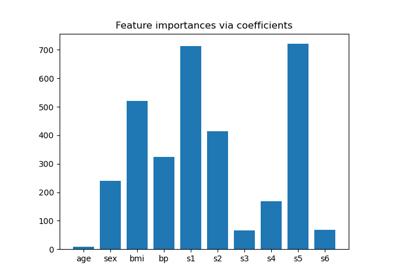
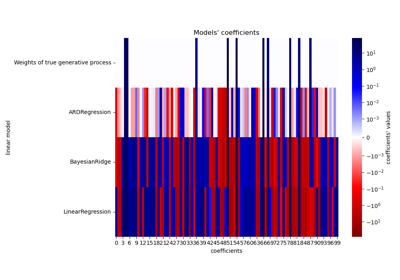
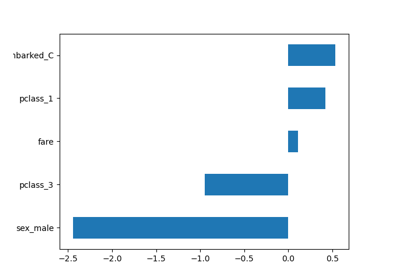
Common pitfalls in the interpretation of coefficients of linear models
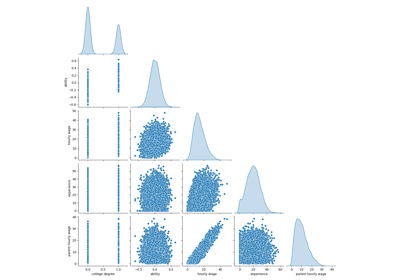
Failure of Machine Learning to infer causal effects
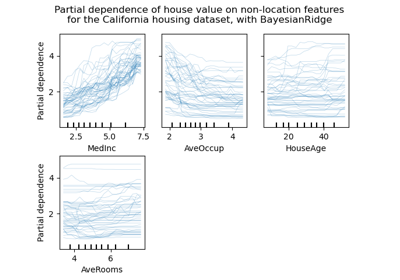
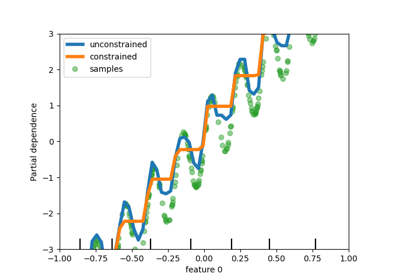
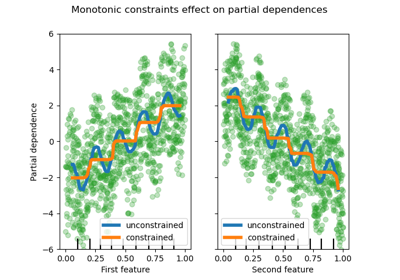
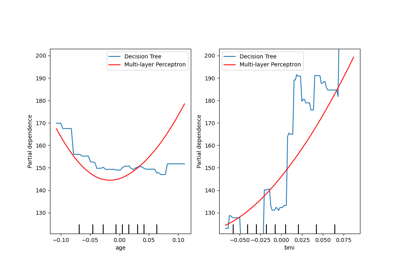
Partial Dependence and Individual Conditional Expectation Plots
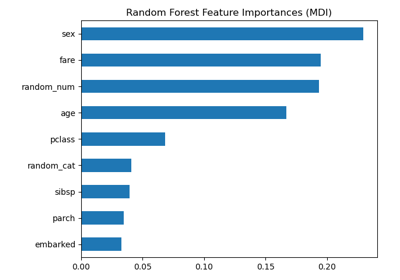
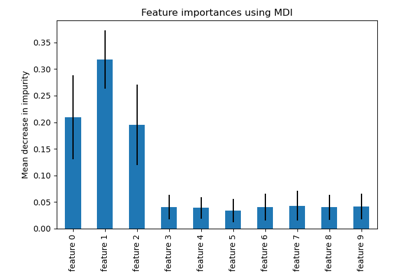
Permutation Importance vs Random Forest Feature Importance (MDI)
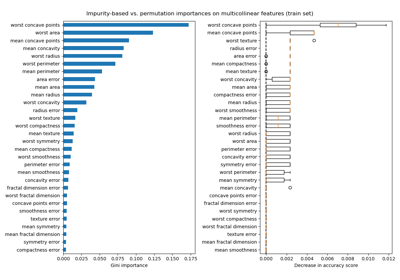
Permutation Importance with Multicollinear or Correlated Features
Kernel Approximation
Examples concerning the sklearn.kernel_approximation module.
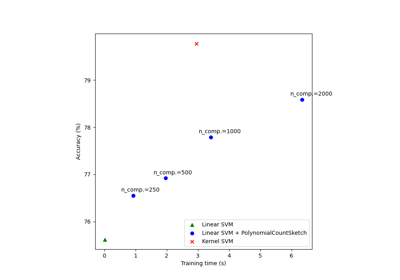
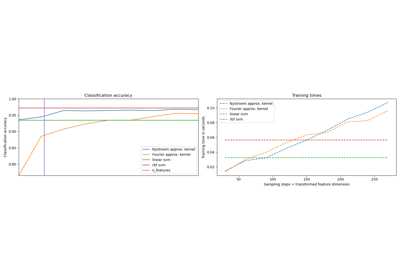
Scalable learning with polynomial kernel approximation
Manifold learning
Examples concerning the sklearn.manifold module.
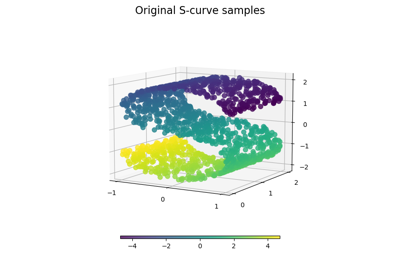
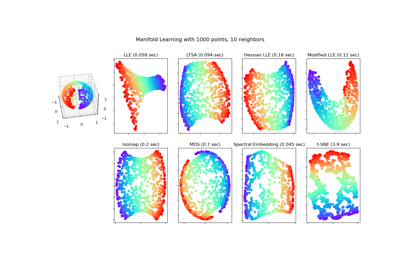
Manifold learning on handwritten digits: Locally Linear Embedding, Isomap…
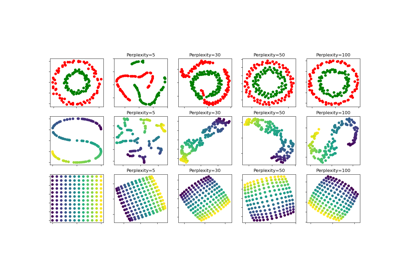
t-SNE: The effect of various perplexity values on the shape
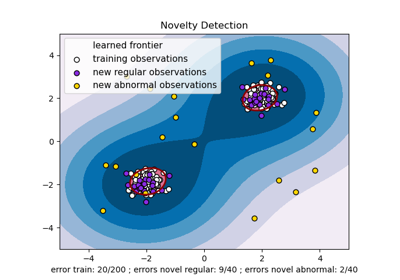
Miscellaneous
Miscellaneous and introductory examples for scikit-learn.
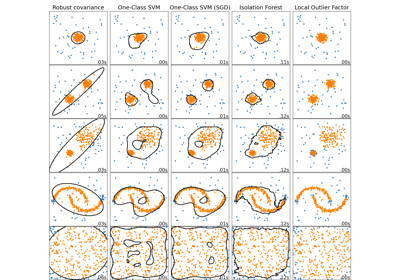
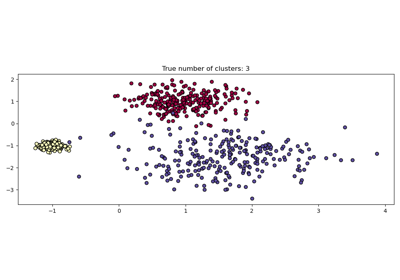
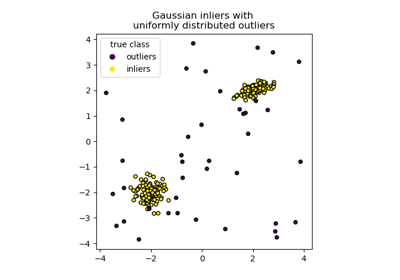
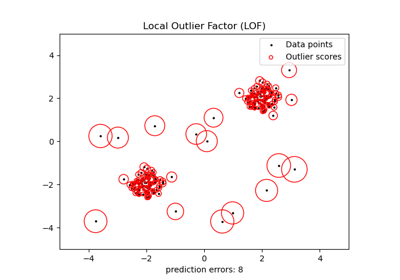
Comparing anomaly detection algorithms for outlier detection on toy datasets


Explicit feature map approximation for RBF kernels

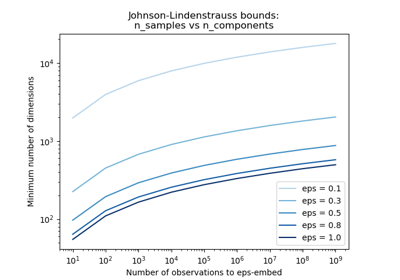
The Johnson-Lindenstrauss bound for embedding with random projections
Missing Value Imputation
Examples concerning the sklearn.impute module.
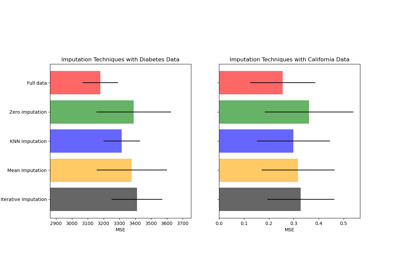
Imputing missing values before building an estimator
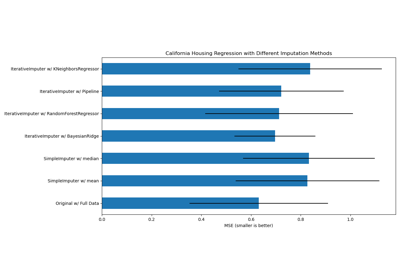
Imputing missing values with variants of IterativeImputer
Model Selection
Examples related to the sklearn.model_selection module.
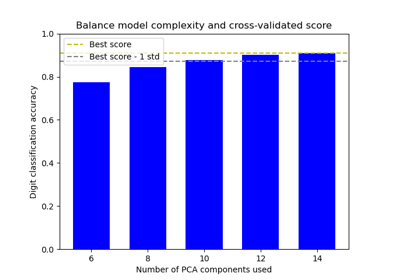
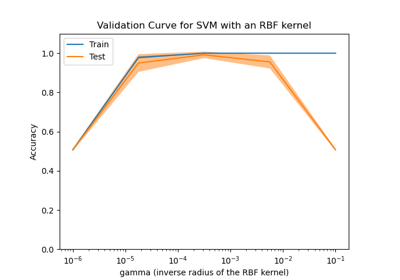
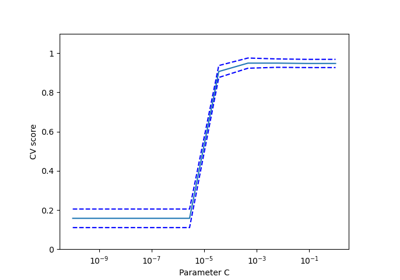
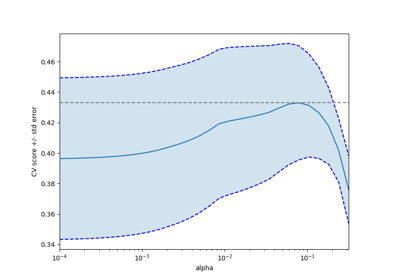
Balance model complexity and cross-validated score
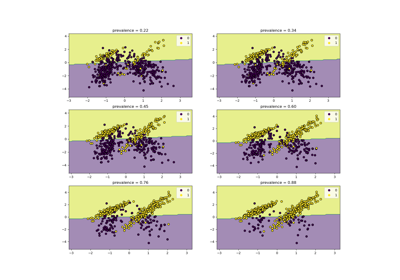
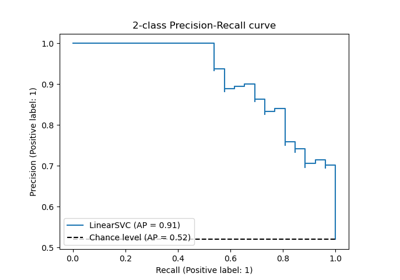
Class Likelihood Ratios to measure classification performance

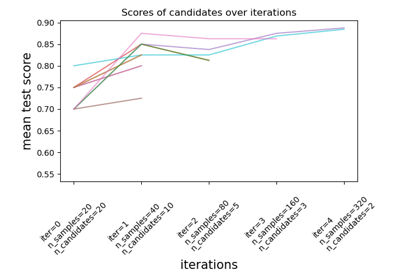
Comparing randomized search and grid search for hyperparameter estimation
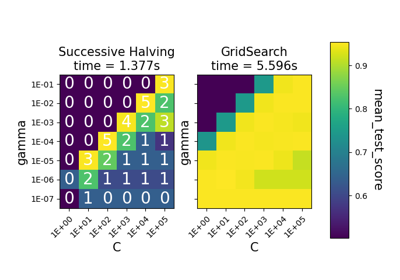
Comparison between grid search and successive halving
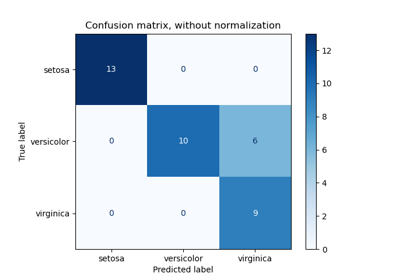

Custom refit strategy of a grid search with cross-validation
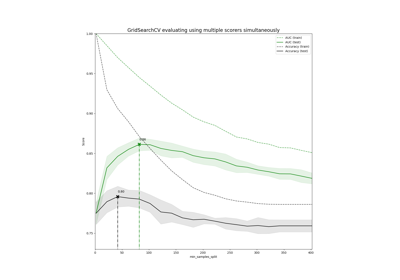
Demonstration of multi-metric evaluation on cross_val_score and GridSearchCV

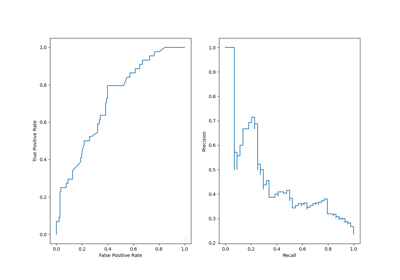
Multiclass Receiver Operating Characteristic (ROC)
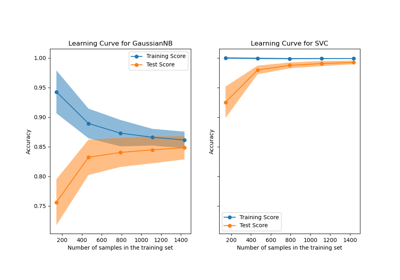
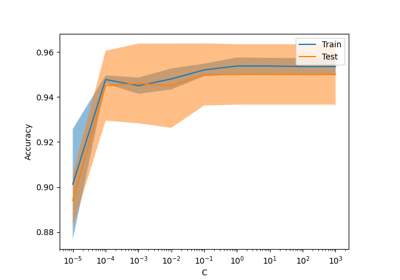
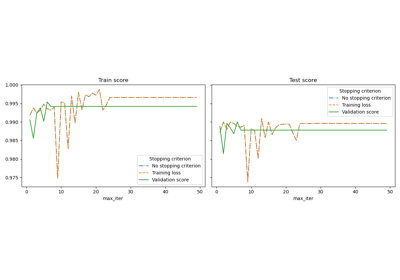
Plotting Learning Curves and Checking Models’ Scalability
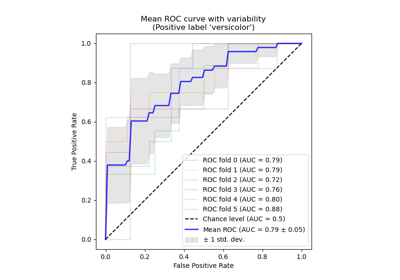
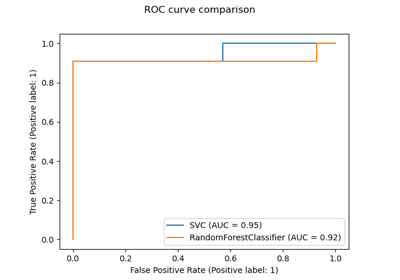
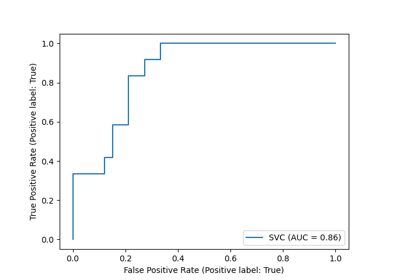
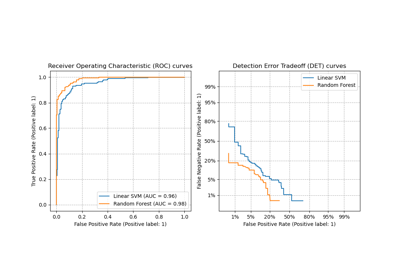
Receiver Operating Characteristic (ROC) with cross validation

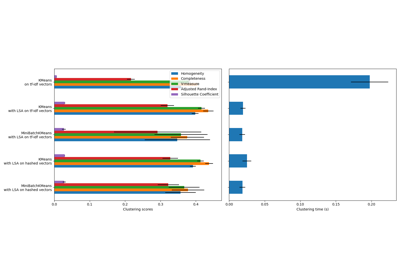
Sample pipeline for text feature extraction and evaluation
Statistical comparison of models using grid search
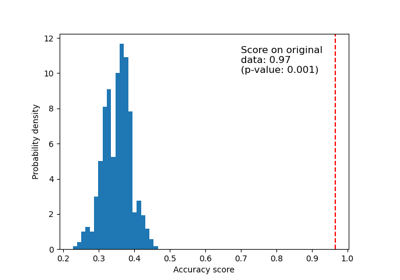
Test with permutations the significance of a classification score
Visualizing cross-validation behavior in scikit-learn
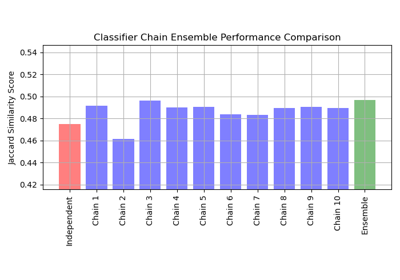
Multioutput methods
Examples concerning the sklearn.multioutput module.
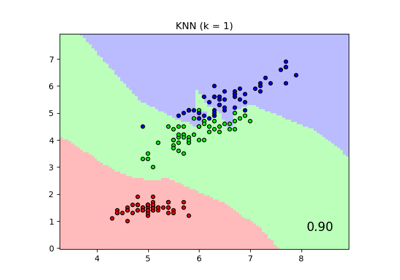
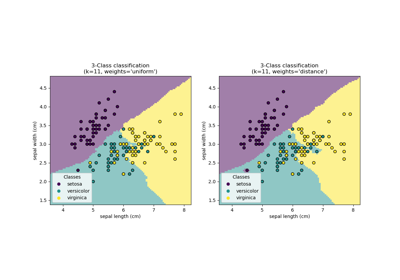
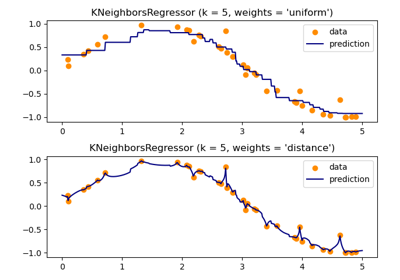
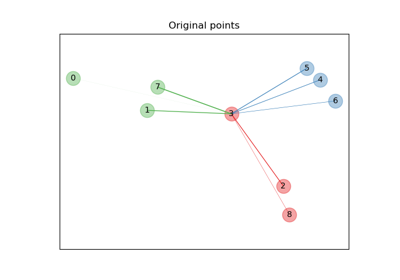
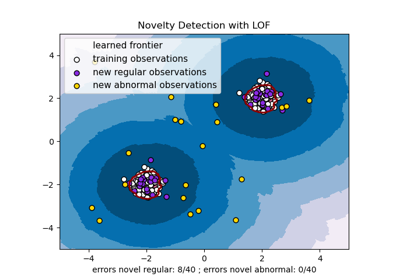
Nearest Neighbors
Examples concerning the sklearn.neighbors module.

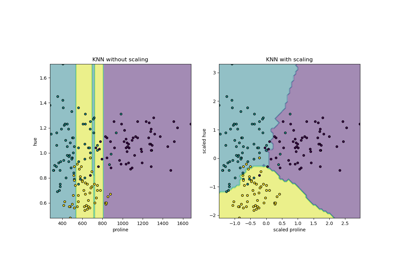
Comparing Nearest Neighbors with and without Neighborhood Components Analysis
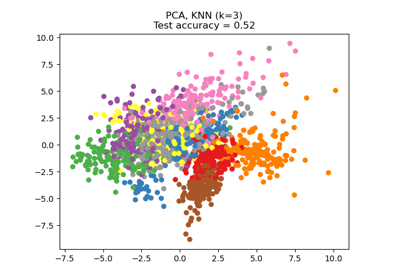
Dimensionality Reduction with Neighborhood Components Analysis
Neural Networks
Examples concerning the sklearn.neural_network module.
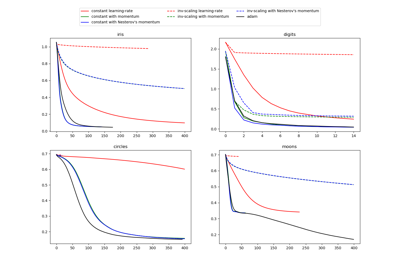
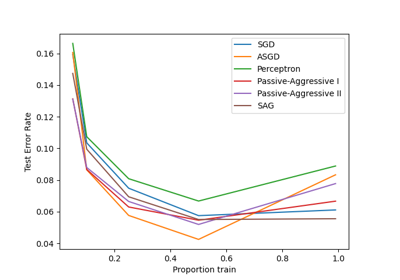
Compare Stochastic learning strategies for MLPClassifier
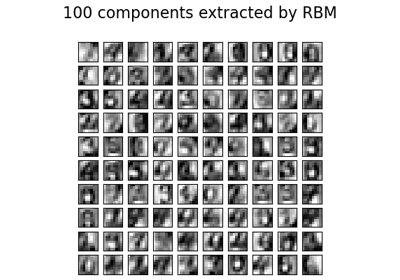
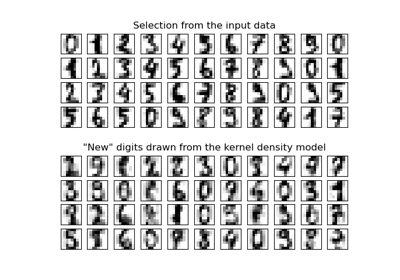
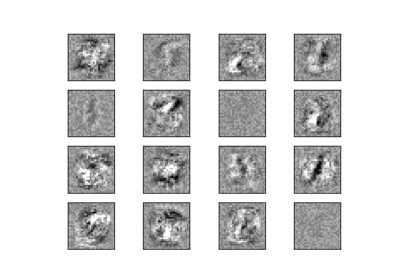
Restricted Boltzmann Machine features for digit classification
Pipelines and composite estimators
Examples of how to compose transformers and pipelines from other estimators. See the User Guide.
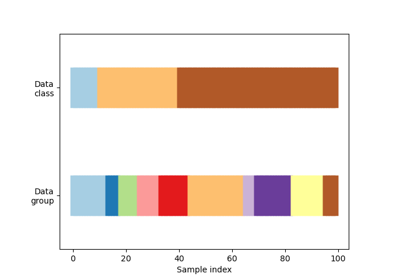
Column Transformer with Heterogeneous Data Sources

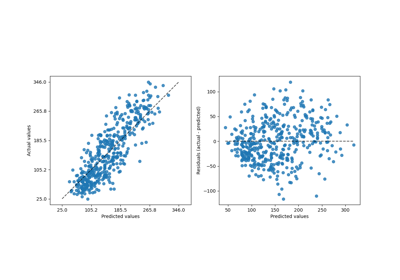
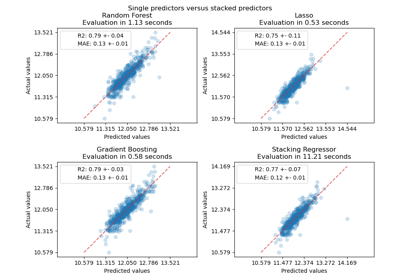
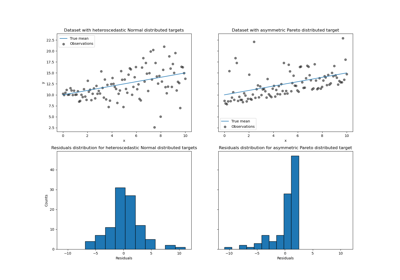
Effect of transforming the targets in regression model
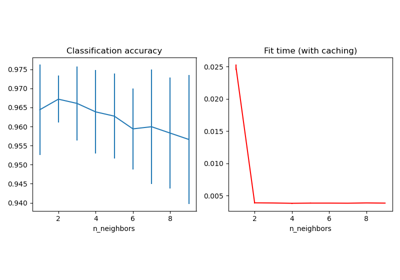
Pipelining: chaining a PCA and a logistic regression
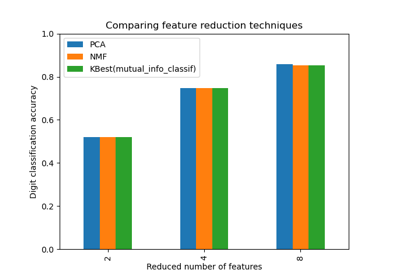
Selecting dimensionality reduction with Pipeline and GridSearchCV
Preprocessing
Examples concerning the sklearn.preprocessing module.
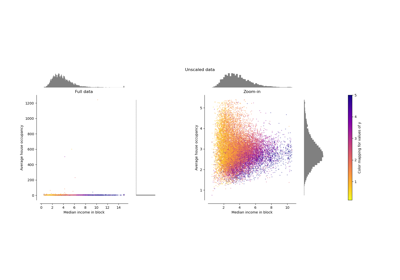
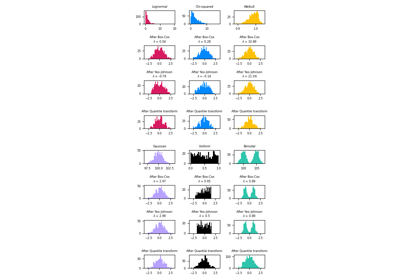
Compare the effect of different scalers on data with outliers
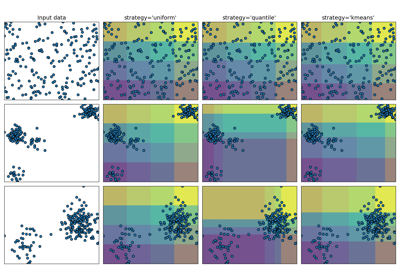
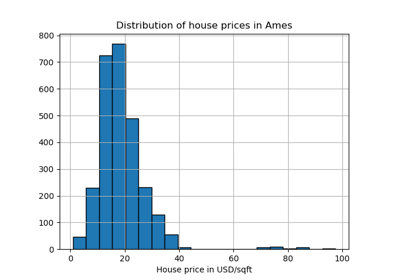
Demonstrating the different strategies of KBinsDiscretizer
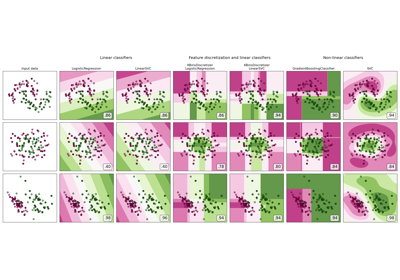
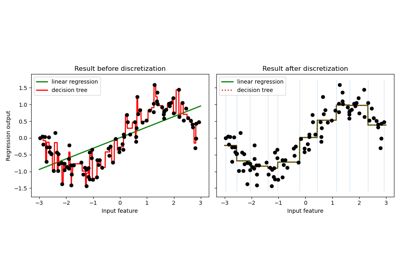
Using KBinsDiscretizer to discretize continuous features
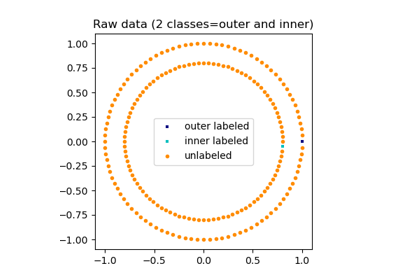
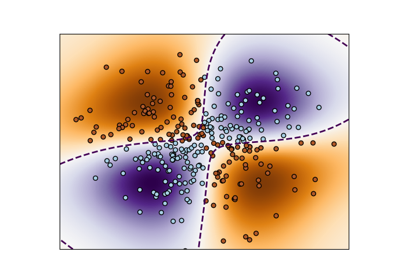
Semi Supervised Classification
Examples concerning the sklearn.semi_supervised module.
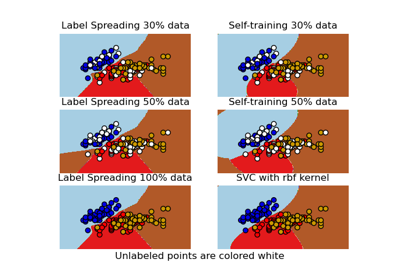
Decision boundary of semi-supervised classifiers versus SVM on the Iris dataset
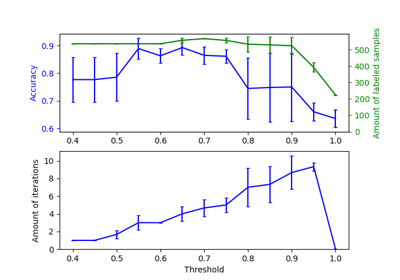
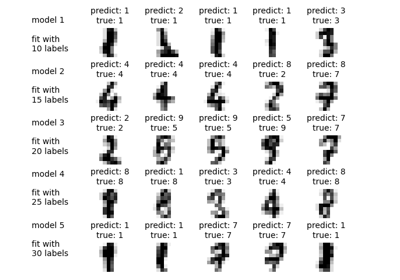
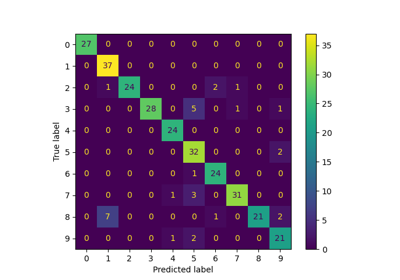
Label Propagation digits: Demonstrating performance

Support Vector Machines
Examples concerning the sklearn.svm module.
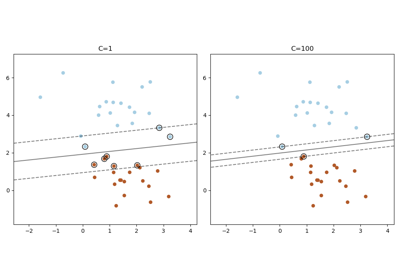
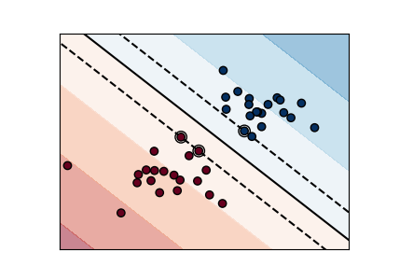
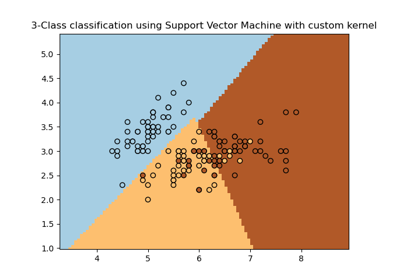
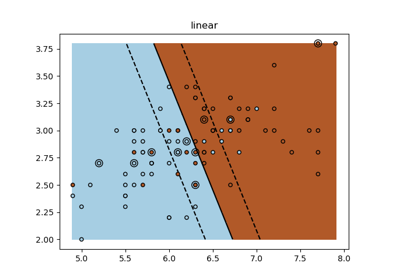
Plot classification boundaries with different SVM Kernels
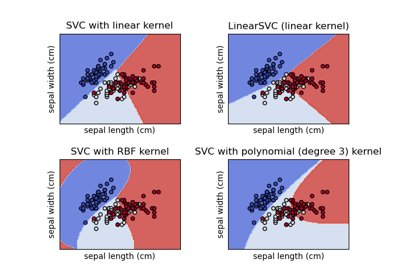
Plot different SVM classifiers in the iris dataset
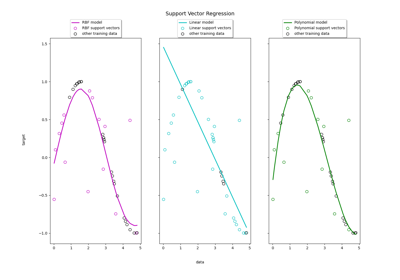
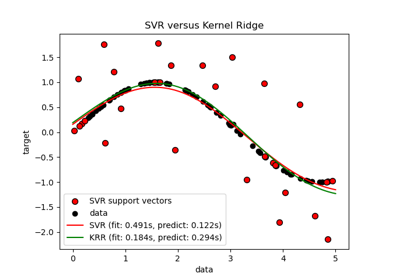
Support Vector Regression (SVR) using linear and non-linear kernels
Tutorial exercises
Exercises for the tutorials

Working with text documents
Examples concerning the sklearn.feature_extraction.text module.
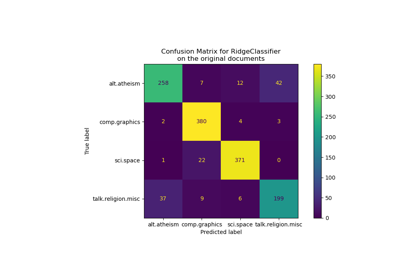
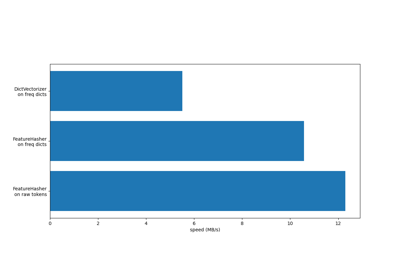
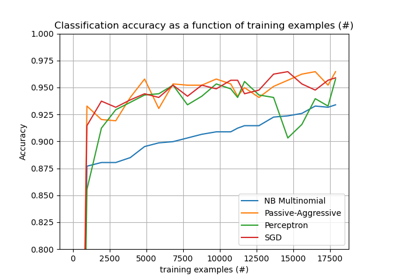
Classification of text documents using sparse features