Note
Go to the end to download the full example code or to run this example in your browser via JupyterLite or Binder
Ledoit-Wolf vs OAS estimation
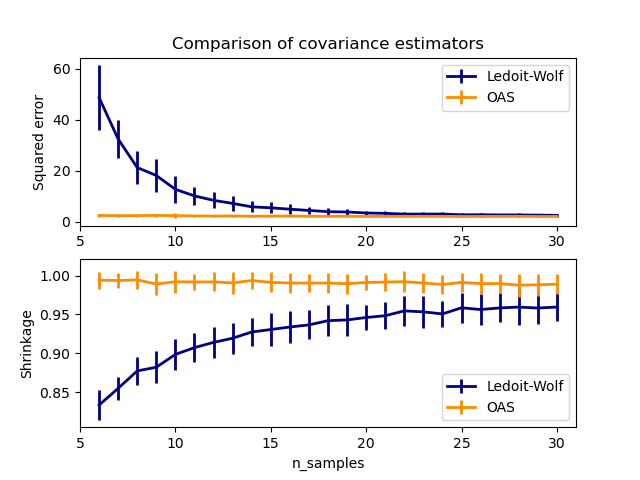
The usual covariance maximum likelihood estimate can be regularized using shrinkage. Ledoit and Wolf proposed a close formula to compute the asymptotically optimal shrinkage parameter (minimizing a MSE criterion), yielding the Ledoit-Wolf covariance estimate.
Chen et al. proposed an improvement of the Ledoit-Wolf shrinkage parameter, the OAS coefficient, whose convergence is significantly better under the assumption that the data are Gaussian.
This example, inspired from Chen’s publication [1], shows a comparison of the estimated MSE of the LW and OAS methods, using Gaussian distributed data.
[1] “Shrinkage Algorithms for MMSE Covariance Estimation” Chen et al., IEEE Trans. on Sign. Proc., Volume 58, Issue 10, October 2010.
import matplotlib.pyplot as plt
import numpy as np
from scipy.linalg import cholesky, toeplitz

from sklearn.covariance import OAS, LedoitWolf

np.random.seed(0)
n_features = 100
# simulation covariance matrix (AR(1) process)
r = 0.1
real_cov = toeplitz(r ** np.arange(n_features))
coloring_matrix = cholesky(real_cov)

n_samples_range = np.arange(6, 31, 1)
repeat = 100
lw_mse = np.zeros((n_samples_range.size, repeat))
oa_mse = np.zeros((n_samples_range.size, repeat))
lw_shrinkage = np.zeros((n_samples_range.size, repeat))
oa_shrinkage = np.zeros((n_samples_range.size, repeat))
for i, n_samples in enumerate(n_samples_range):
    for j in range(repeat):
        X = np.dot(np.random.normal(size=(n_samples, n_features)), coloring_matrix.T)

        lw = LedoitWolf(store_precision=False, assume_centered=True)
        lw.fit(X)
        lw_mse[i, j] = lw.error_norm(real_cov, scaling=False)
        lw_shrinkage[i, j] = lw.shrinkage_

        oa = OAS(store_precision=False, assume_centered=True)
        oa.fit(X)
        oa_mse[i, j] = oa.error_norm(real_cov, scaling=False)
        oa_shrinkage[i, j] = oa.shrinkage_

# plot MSE
plt.subplot(2, 1, 1)
plt.errorbar(
    n_samples_range,
    lw_mse.mean(1),
    yerr=lw_mse.std(1),
    label="Ledoit-Wolf",
    color="navy",
    lw=2,
)
plt.errorbar(
    n_samples_range,
    oa_mse.mean(1),
    yerr=oa_mse.std(1),
    label="OAS",
    color="darkorange",
    lw=2,
)
plt.ylabel("Squared error")
plt.legend(loc="upper right")
plt.title("Comparison of covariance estimators")
plt.xlim(5, 31)

# plot shrinkage coefficient
plt.subplot(2, 1, 2)
plt.errorbar(
    n_samples_range,
    lw_shrinkage.mean(1),
    yerr=lw_shrinkage.std(1),
    label="Ledoit-Wolf",
    color="navy",
    lw=2,
)
plt.errorbar(
    n_samples_range,
    oa_shrinkage.mean(1),
    yerr=oa_shrinkage.std(1),
    label="OAS",
    color="darkorange",
    lw=2,
)
plt.xlabel("n_samples")
plt.ylabel("Shrinkage")
plt.legend(loc="lower right")
plt.ylim(plt.ylim()[0], 1.0 + (plt.ylim()[1] - plt.ylim()[0]) / 10.0)
plt.xlim(5, 31)

plt.show()

Total running time of the script: (0 minutes 2.796 seconds)