Note
Go to the end to download the full example code or to run this example in your browser via JupyterLite or Binder
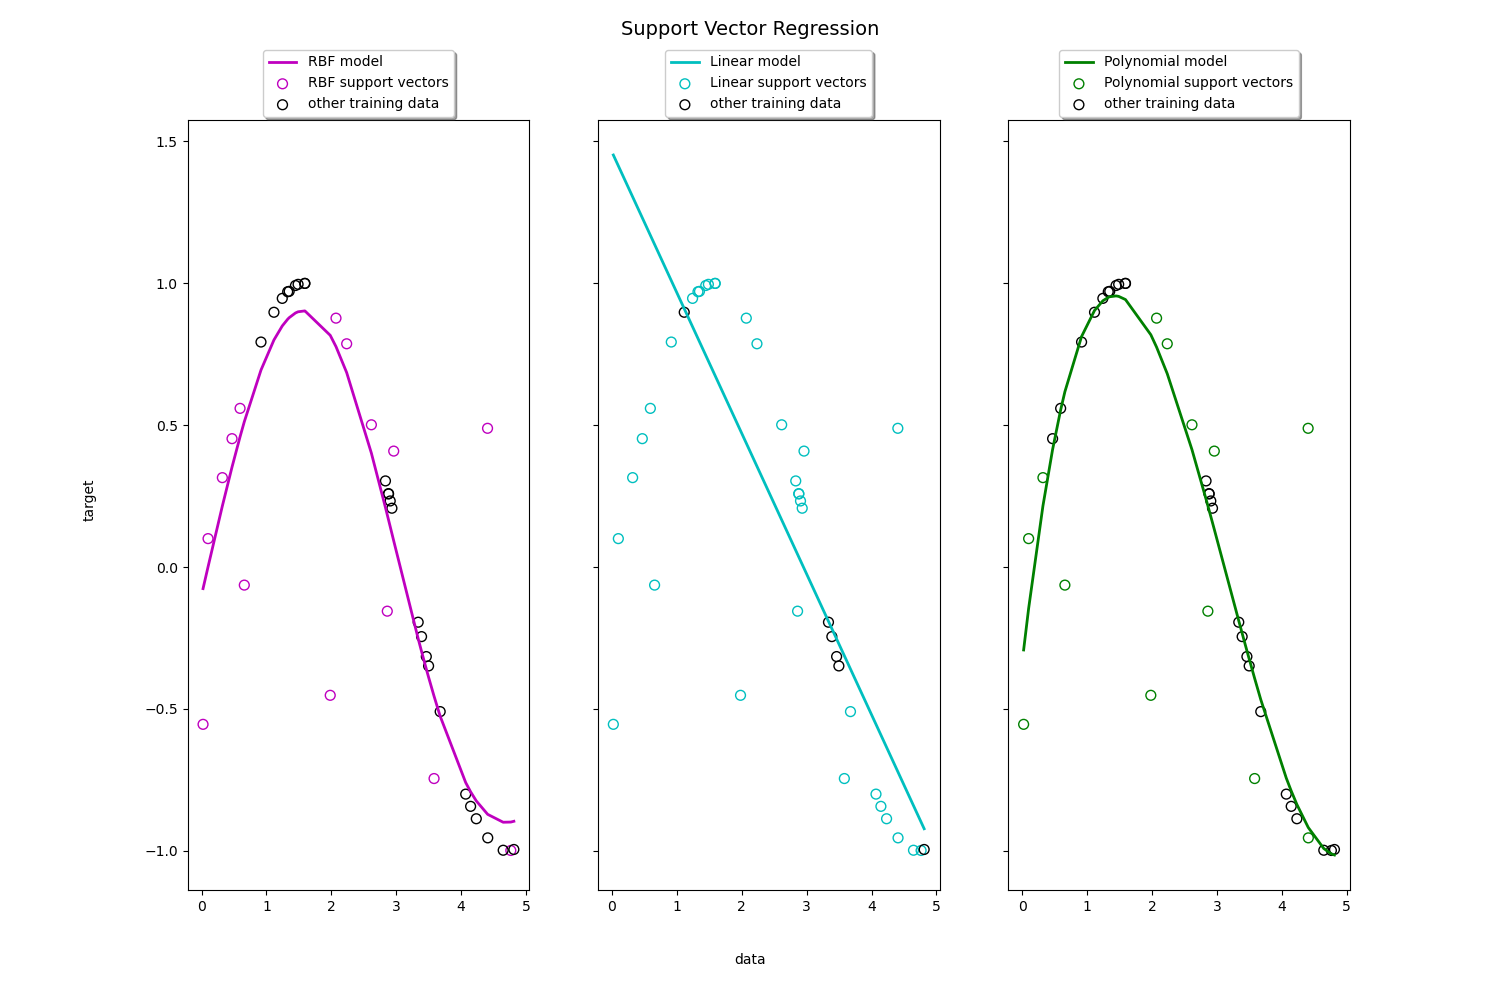
Support Vector Regression (SVR) using linear and non-linear kernels
Toy example of 1D regression using linear, polynomial and RBF kernels.
import matplotlib.pyplot as plt
import numpy as np

from sklearn.svm import SVR
Generate sample data
X = np.sort(5 * np.random.rand(40, 1), axis=0)
y = np.sin(X).ravel()

# add noise to targets
y[::5] += 3 * (0.5 - np.random.rand(8))
Fit regression model
Look at the results
lw = 2

svrs = [svr_rbf, svr_lin, svr_poly]
kernel_label = ["RBF", "Linear", "Polynomial"]
model_color = ["m", "c", "g"]

fig, axes = plt.subplots(nrows=1, ncols=3, figsize=(15, 10), sharey=True)
for ix, svr in enumerate(svrs):
    axes[ix].plot(
        X,
        svr.fit(X, y).predict(X),
        color=model_color[ix],
        lw=lw,
        label="{} model".format(kernel_label[ix]),
    )
    axes[ix].scatter(
        X[svr.support_],
        y[svr.support_],
        facecolor="none",
        edgecolor=model_color[ix],
        s=50,
        label="{} support vectors".format(kernel_label[ix]),
    )
    axes[ix].scatter(
        X[np.setdiff1d(np.arange(len(X)), svr.support_)],
        y[np.setdiff1d(np.arange(len(X)), svr.support_)],
        facecolor="none",
        edgecolor="k",
        s=50,
        label="other training data",
    )
    axes[ix].legend(
        loc="upper center",
        bbox_to_anchor=(0.5, 1.1),
        ncol=1,
        fancybox=True,
        shadow=True,
    )

fig.text(0.5, 0.04, "data", ha="center", va="center")
fig.text(0.06, 0.5, "target", ha="center", va="center", rotation="vertical")
fig.suptitle("Support Vector Regression", fontsize=14)
plt.show()

Total running time of the script: (0 minutes 0.428 seconds)