Note
Go to the end to download the full example code or to run this example in your browser via JupyterLite or Binder.
Robust linear model estimation using RANSAC#
In this example, we see how to robustly fit a linear model to faulty data using the RANSAC algorithm.
The ordinary linear regressor is sensitive to outliers, and the fitted line can easily be skewed away from the true underlying relationship of data.
The RANSAC regressor automatically splits the data into inliers and outliers, and the fitted line is determined only by the identified inliers.
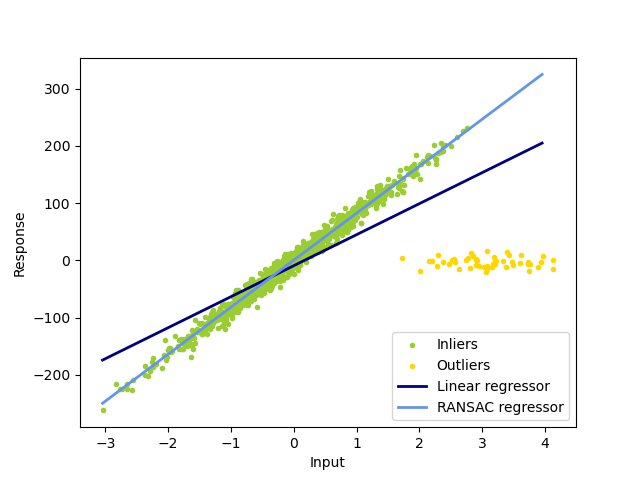
Estimated coefficients (true, linear regression, RANSAC):
82.1903908407869 [54.17236387] [82.08533159]
# Authors: The scikit-learn developers
# SPDX-License-Identifier: BSD-3-Clause

import numpy as np
from matplotlib import pyplot as plt

from sklearn import datasets, linear_model

n_samples = 1000
n_outliers = 50


X, y, coef = datasets.make_regression(
    n_samples=n_samples,
    n_features=1,
    n_informative=1,
    noise=10,
    coef=True,
    random_state=0,
)

# Add outlier data
np.random.seed(0)
X[:n_outliers] = 3 + 0.5 * np.random.normal(size=(n_outliers, 1))
y[:n_outliers] = -3 + 10 * np.random.normal(size=n_outliers)

# Fit line using all data
lr = linear_model.LinearRegression()
lr.fit(X, y)

# Robustly fit linear model with RANSAC algorithm
ransac = linear_model.RANSACRegressor()
ransac.fit(X, y)
inlier_mask = ransac.inlier_mask_
outlier_mask = np.logical_not(inlier_mask)

# Predict data of estimated models
line_X = np.arange(X.min(), X.max())[:, np.newaxis]
line_y = lr.predict(line_X)
line_y_ransac = ransac.predict(line_X)

# Compare estimated coefficients
print("Estimated coefficients (true, linear regression, RANSAC):")
print(coef, lr.coef_, ransac.estimator_.coef_)

lw = 2
plt.scatter(
    X[inlier_mask], y[inlier_mask], color="yellowgreen", marker=".", label="Inliers"
)
plt.scatter(
    X[outlier_mask], y[outlier_mask], color="gold", marker=".", label="Outliers"
)
plt.plot(line_X, line_y, color="navy", linewidth=lw, label="Linear regressor")
plt.plot(
    line_X,
    line_y_ransac,
    color="cornflowerblue",
    linewidth=lw,
    label="RANSAC regressor",
)
plt.legend(loc="lower right")
plt.xlabel("Input")
plt.ylabel("Response")
plt.show()
Total running time of the script: (0 minutes 0.082 seconds)
Related examples
Robust covariance estimation and Mahalanobis distances relevance
Robust covariance estimation and Mahalanobis distances relevance