Note
Go to the end to download the full example code or to run this example in your browser via JupyterLite or Binder.
Demonstration of multi-metric evaluation on cross_val_score and GridSearchCV#
Multiple metric parameter search can be done by setting the scoring
parameter to a list of metric scorer names or a dict mapping the scorer names
to the scorer callables.
The scores of all the scorers are available in the cv_results_ dict at keys
ending in '_<scorer_name>' ('mean_test_precision',
'rank_test_precision', etc…)
The best_estimator_, best_index_, best_score_ and best_params_
correspond to the scorer (key) that is set to the refit attribute.
# Authors: The scikit-learn developers
# SPDX-License-Identifier: BSD-3-Clause

import numpy as np
from matplotlib import pyplot as plt

from sklearn.datasets import make_hastie_10_2
from sklearn.metrics import accuracy_score, make_scorer
from sklearn.model_selection import GridSearchCV
from sklearn.tree import DecisionTreeClassifier
Running GridSearchCV using multiple evaluation metrics#
X, y = make_hastie_10_2(n_samples=8000, random_state=42)

# The scorers can be either one of the predefined metric strings or a scorer
# callable, like the one returned by make_scorer
scoring = {"AUC": "roc_auc", "Accuracy": make_scorer(accuracy_score)}

# Setting refit='AUC', refits an estimator on the whole dataset with the
# parameter setting that has the best cross-validated AUC score.
# That estimator is made available at ``gs.best_estimator_`` along with
# parameters like ``gs.best_score_``, ``gs.best_params_`` and
# ``gs.best_index_``
gs = GridSearchCV(
    DecisionTreeClassifier(random_state=42),
    param_grid={"min_samples_split": range(2, 403, 20)},
    scoring=scoring,
    refit="AUC",
    n_jobs=2,
    return_train_score=True,
)
gs.fit(X, y)
results = gs.cv_results_
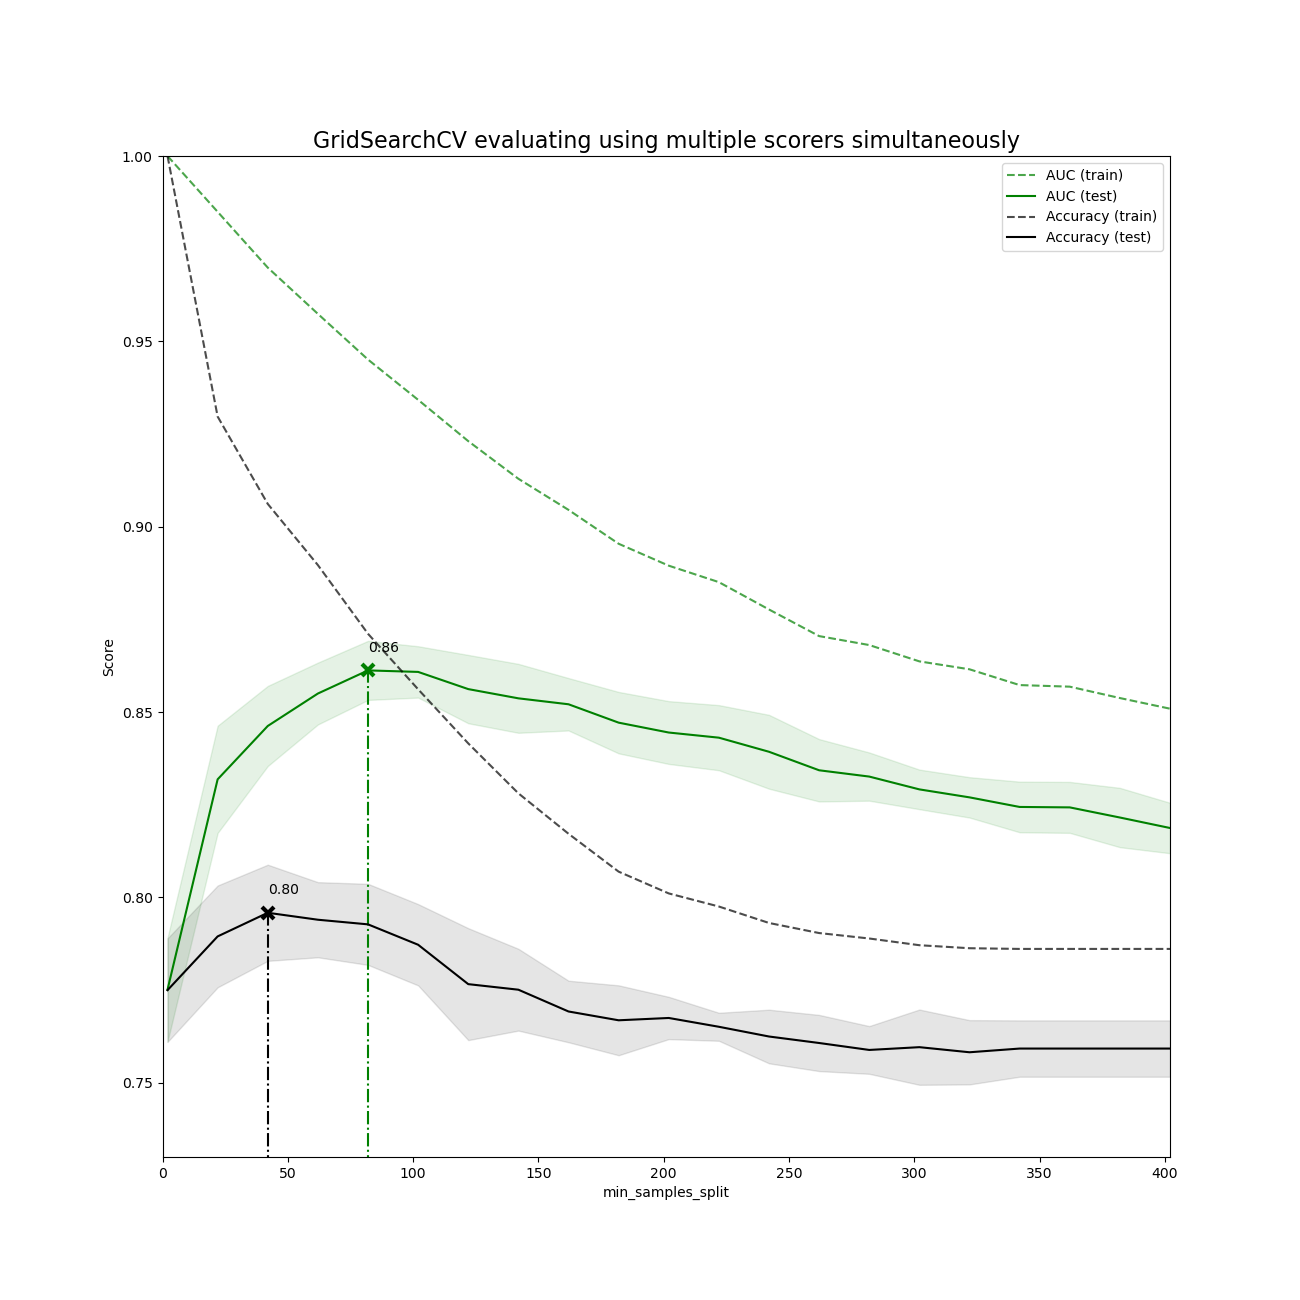
Plotting the result#
plt.figure(figsize=(13, 13))
plt.title("GridSearchCV evaluating using multiple scorers simultaneously", fontsize=16)

plt.xlabel("min_samples_split")
plt.ylabel("Score")

ax = plt.gca()
ax.set_xlim(0, 402)
ax.set_ylim(0.73, 1)

# Get the regular numpy array from the MaskedArray
X_axis = np.array(results["param_min_samples_split"].data, dtype=float)

for scorer, color in zip(sorted(scoring), ["g", "k"]):
    for sample, style in (("train", "--"), ("test", "-")):
        sample_score_mean = results["mean_%s_%s" % (sample, scorer)]
        sample_score_std = results["std_%s_%s" % (sample, scorer)]
        ax.fill_between(
            X_axis,
            sample_score_mean - sample_score_std,
            sample_score_mean + sample_score_std,
            alpha=0.1 if sample == "test" else 0,
            color=color,
        )
        ax.plot(
            X_axis,
            sample_score_mean,
            style,
            color=color,
            alpha=1 if sample == "test" else 0.7,
            label="%s (%s)" % (scorer, sample),
        )

    best_index = np.nonzero(results["rank_test_%s" % scorer] == 1)[0][0]
    best_score = results["mean_test_%s" % scorer][best_index]

    # Plot a dotted vertical line at the best score for that scorer marked by x
    ax.plot(
        [
            X_axis[best_index],
        ]
        * 2,
        [0, best_score],
        linestyle="-.",
        color=color,
        marker="x",
        markeredgewidth=3,
        ms=8,
    )

    # Annotate the best score for that scorer
    ax.annotate("%0.2f" % best_score, (X_axis[best_index], best_score + 0.005))

plt.legend(loc="best")
plt.grid(False)
plt.show()
Total running time of the script: (0 minutes 8.563 seconds)
Related examples
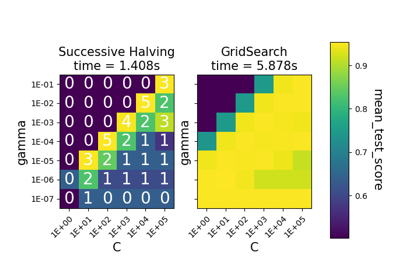
Comparison between grid search and successive halving
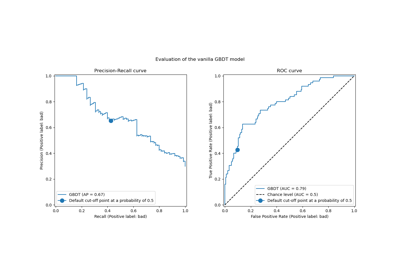
Post-tuning the decision threshold for cost-sensitive learning

Custom refit strategy of a grid search with cross-validation
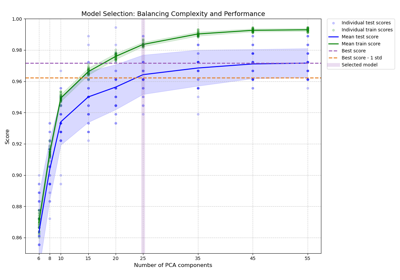
Balance model complexity and cross-validated score
