Note
Go to the end to download the full example code or to run this example in your browser via JupyterLite or Binder.
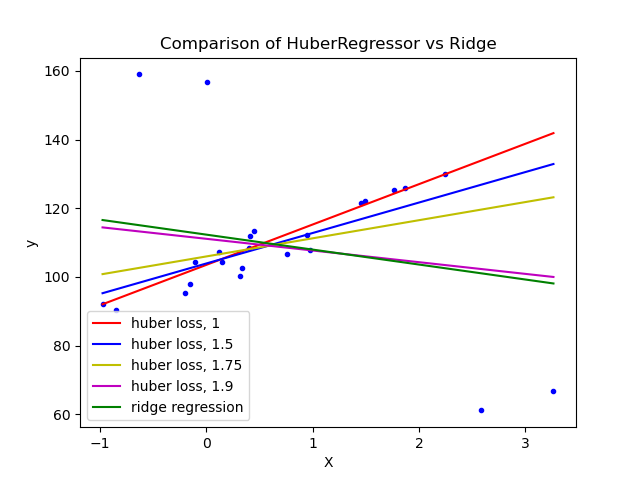
HuberRegressor vs Ridge on dataset with strong outliers#
Fit Ridge and HuberRegressor on a dataset with outliers.
The example shows that the predictions in ridge are strongly influenced by the outliers present in the dataset. The Huber regressor is less influenced by the outliers since the model uses the linear loss for these. As the parameter epsilon is increased for the Huber regressor, the decision function approaches that of the ridge.
# Authors: The scikit-learn developers
# SPDX-License-Identifier: BSD-3-Clause

import matplotlib.pyplot as plt
import numpy as np

from sklearn.datasets import make_regression
from sklearn.linear_model import HuberRegressor, Ridge

# Generate toy data.
rng = np.random.RandomState(0)
X, y = make_regression(
    n_samples=20, n_features=1, random_state=0, noise=4.0, bias=100.0
)

# Add four strong outliers to the dataset.
X_outliers = rng.normal(0, 0.5, size=(4, 1))
y_outliers = rng.normal(0, 2.0, size=4)
X_outliers[:2, :] += X.max() + X.mean() / 4.0
X_outliers[2:, :] += X.min() - X.mean() / 4.0
y_outliers[:2] += y.min() - y.mean() / 4.0
y_outliers[2:] += y.max() + y.mean() / 4.0
X = np.vstack((X, X_outliers))
y = np.concatenate((y, y_outliers))
plt.plot(X, y, "b.")

# Fit the huber regressor over a series of epsilon values.
colors = ["r-", "b-", "y-", "m-"]

x = np.linspace(X.min(), X.max(), 7)
epsilon_values = [1, 1.5, 1.75, 1.9]
for k, epsilon in enumerate(epsilon_values):
    huber = HuberRegressor(alpha=0.0, epsilon=epsilon)
    huber.fit(X, y)
    coef_ = huber.coef_ * x + huber.intercept_
    plt.plot(x, coef_, colors[k], label="huber loss, %s" % epsilon)

# Fit a ridge regressor to compare it to huber regressor.
ridge = Ridge(alpha=0.0, random_state=0)
ridge.fit(X, y)
coef_ridge = ridge.coef_
coef_ = ridge.coef_ * x + ridge.intercept_
plt.plot(x, coef_, "g-", label="ridge regression")

plt.title("Comparison of HuberRegressor vs Ridge")
plt.xlabel("X")
plt.ylabel("y")
plt.legend(loc=0)
plt.show()
Total running time of the script: (0 minutes 0.091 seconds)
Related examples
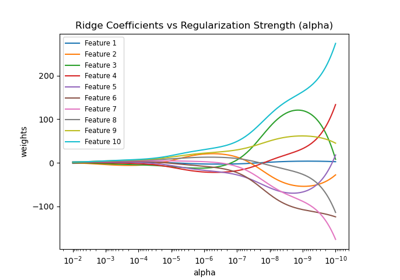
Plot Ridge coefficients as a function of the regularization
Plot Ridge coefficients as a function of the regularization

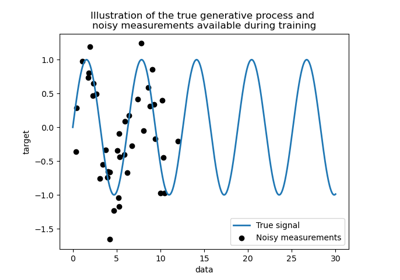
Comparison of kernel ridge and Gaussian process regression
Comparison of kernel ridge and Gaussian process regression