load_iris#
- sklearn.datasets.load_iris(*, return_X_y=False, as_frame=False)[source]#
Load and return the iris dataset (classification).
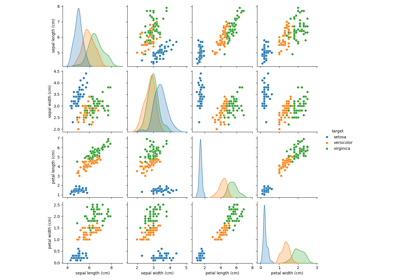
The iris dataset is a classic and very easy multi-class classification dataset.
Classes
3
Samples per class
50
Samples total
150
Dimensionality
4
Features
real, positive
Read more in the User Guide.
Changed in version 0.20: Fixed two wrong data points according to Fisher’s paper. The new version is the same as in R, but not as in the UCI Machine Learning Repository.
- Parameters:
- return_X_ybool, default=False
If True, returns
(data, target)instead of a Bunch object. See below for more information about thedataandtargetobject.Added in version 0.18.
- as_framebool, default=False
If True, the data is a pandas DataFrame including columns with appropriate dtypes (numeric). The target is a pandas DataFrame or Series depending on the number of target columns. If
return_X_yis True, then (data,target) will be pandas DataFrames or Series as described below.Added in version 0.23.
- Returns:
- data
Bunch Dictionary-like object, with the following attributes.
- data{ndarray, dataframe} of shape (150, 4)
The data matrix. If
as_frame=True,datawill be a pandas DataFrame.- target: {ndarray, Series} of shape (150,)
The classification target. If
as_frame=True,targetwill be a pandas Series.- feature_names: list
The names of the dataset columns.
- target_names: list
The names of target classes.
- frame: DataFrame of shape (150, 5)
Only present when
as_frame=True. DataFrame withdataandtarget.Added in version 0.23.
- DESCR: str
The full description of the dataset.
- filename: str
The path to the location of the data.
Added in version 0.20.
- (data, target)tuple if
return_X_yis True A tuple of two ndarray. The first containing a 2D array of shape (n_samples, n_features) with each row representing one sample and each column representing the features. The second ndarray of shape (n_samples,) containing the target samples.
Added in version 0.18.
- data
Examples
Let’s say you are interested in the samples 10, 25, and 50, and want to know their class name.
>>> from sklearn.datasets import load_iris
>>> data = load_iris()
>>> data.target[[10, 25, 50]]
array([0, 0, 1])
>>> list(data.target_names)
[np.str_('setosa'), np.str_('versicolor'), np.str_('virginica')]
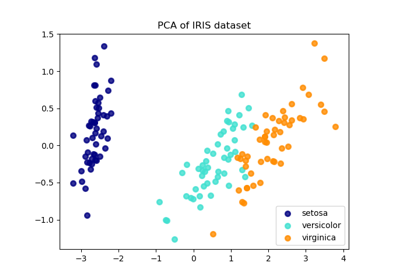
See Principal Component Analysis (PCA) on Iris Dataset for a more detailed example of how to work with the iris dataset.
Gallery examples#
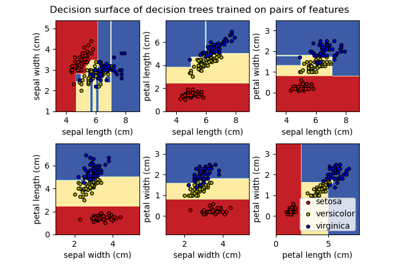
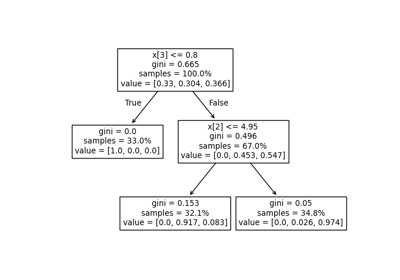
Plot the decision surface of decision trees trained on the iris dataset
Comparison of LDA and PCA 2D projection of Iris dataset
Factor Analysis (with rotation) to visualize patterns
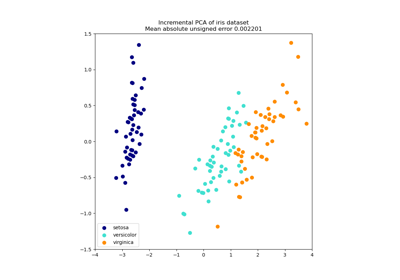
Principal Component Analysis (PCA) on Iris Dataset
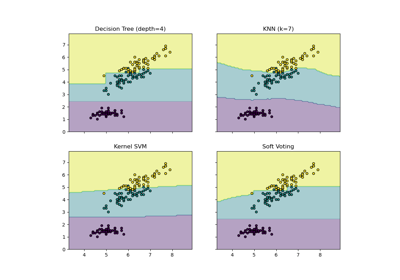
Plot the decision boundaries of a VotingClassifier
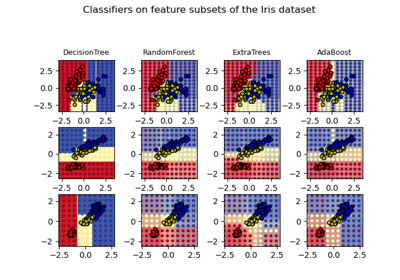
Plot the decision surfaces of ensembles of trees on the iris dataset
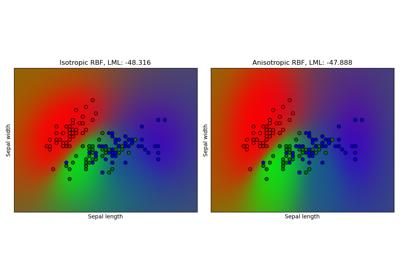
Gaussian process classification (GPC) on iris dataset

Multiclass Receiver Operating Characteristic (ROC)
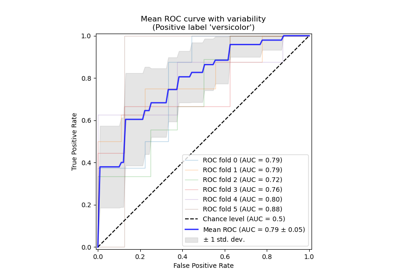
Receiver Operating Characteristic (ROC) with cross validation
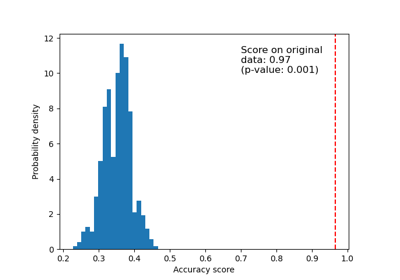
Test with permutations the significance of a classification score
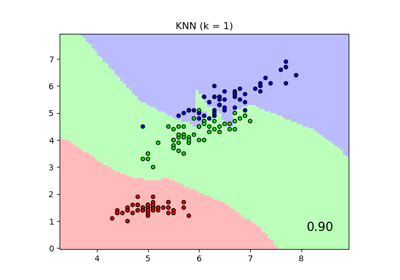
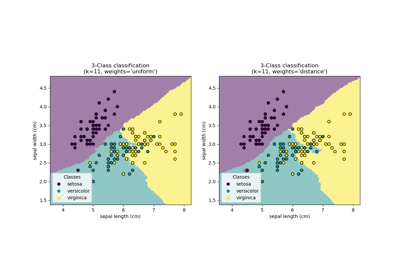
Comparing Nearest Neighbors with and without Neighborhood Components Analysis
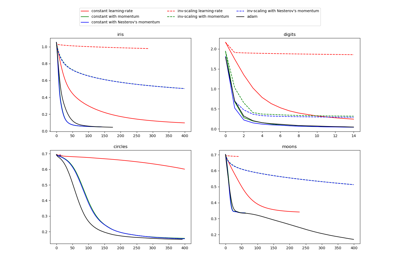
Compare Stochastic learning strategies for MLPClassifier

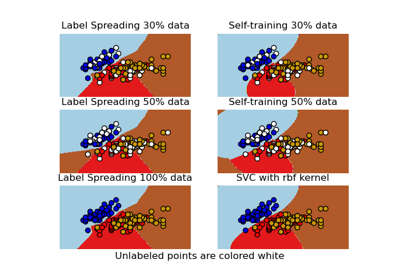
Decision boundary of semi-supervised classifiers versus SVM on the Iris dataset
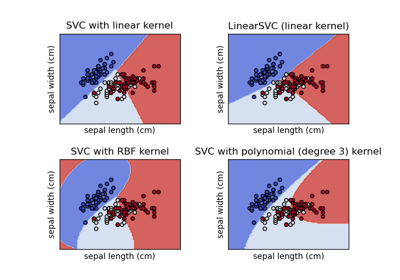
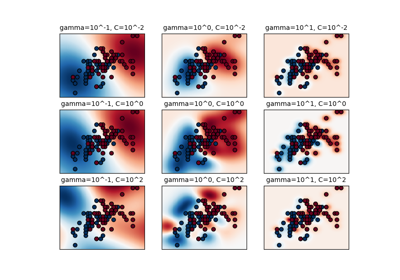
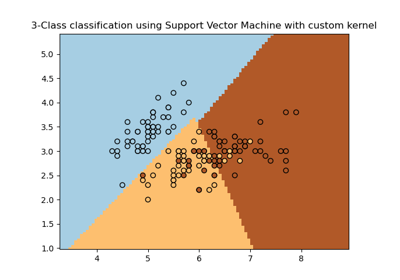
Plot different SVM classifiers in the iris dataset