make_moons#
- sklearn.datasets.make_moons(n_samples=100, *, shuffle=True, noise=None, random_state=None)[source]#
Make two interleaving half circles.
A simple toy dataset to visualize clustering and classification algorithms. Read more in the User Guide.
- Parameters:
- n_samplesint or tuple of shape (2,), dtype=int, default=100
If int, the total number of points generated. If two-element tuple, number of points in each of two moons.
Changed in version 0.23: Added two-element tuple.
- shufflebool, default=True
Whether to shuffle the samples.
- noisefloat, default=None
Standard deviation of Gaussian noise added to the data.
- random_stateint, RandomState instance or None, default=None
Determines random number generation for dataset shuffling and noise. Pass an int for reproducible output across multiple function calls. See Glossary.
- Returns:
- Xndarray of shape (n_samples, 2)
The generated samples.
- yndarray of shape (n_samples,)
The integer labels (0 or 1) for class membership of each sample.
Examples
>>> from sklearn.datasets import make_moons
>>> X, y = make_moons(n_samples=200, noise=0.2, random_state=42)
>>> X.shape
(200, 2)
>>> y.shape
(200,)
Gallery examples#
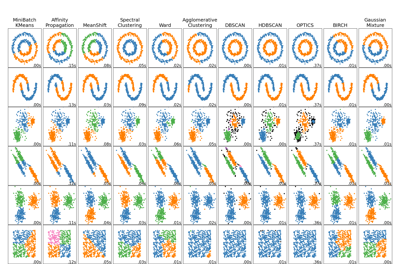
Comparing different clustering algorithms on toy datasets
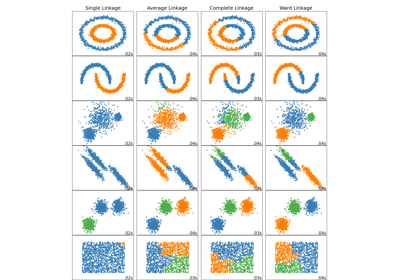
Comparing different hierarchical linkage methods on toy datasets
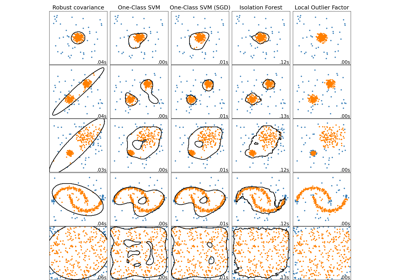
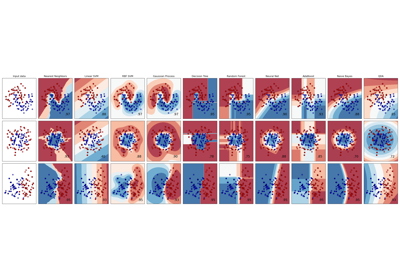
Comparing anomaly detection algorithms for outlier detection on toy datasets
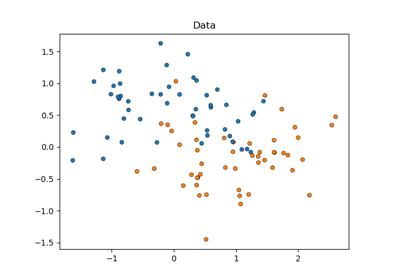
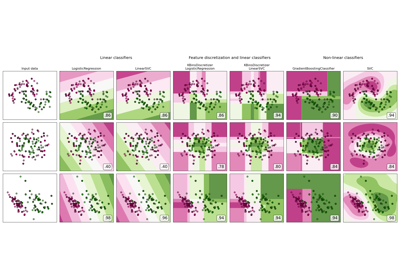
Statistical comparison of models using grid search
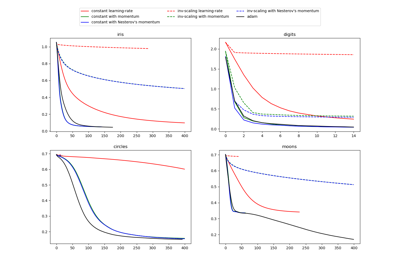
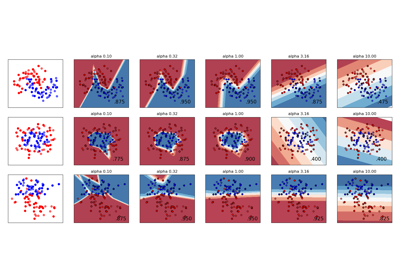
Compare Stochastic learning strategies for MLPClassifier