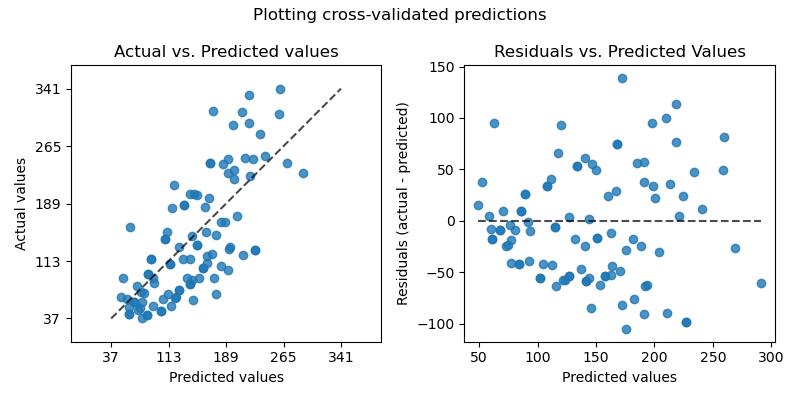
Plotting Cross-Validated Predictions#
This example shows how to use
cross_val_predict together with
PredictionErrorDisplay to visualize prediction
errors.
We will load the diabetes dataset and create an instance of a linear regression model.
from sklearn.datasets import load_diabetes
from sklearn.linear_model import LinearRegression

X, y = load_diabetes(return_X_y=True)
lr = LinearRegression()
cross_val_predict returns an array of the
same size of y where each entry is a prediction obtained by cross
validation.
from sklearn.model_selection import cross_val_predict

y_pred = cross_val_predict(lr, X, y, cv=10)
Since cv=10, it means that we trained 10 models and each model was
used to predict on one of the 10 folds. We can now use the
PredictionErrorDisplay to visualize the
prediction errors.
On the left axis, we plot the observed values \(y\) vs. the predicted values \(\hat{y}\) given by the models. On the right axis, we plot the residuals (i.e. the difference between the observed values and the predicted values) vs. the predicted values.
import matplotlib.pyplot as plt

from sklearn.metrics import PredictionErrorDisplay

fig, axs = plt.subplots(ncols=2, figsize=(8, 4))
PredictionErrorDisplay.from_predictions(
    y,
    y_pred=y_pred,
    kind="actual_vs_predicted",
    subsample=100,
    ax=axs[0],
    random_state=0,
)
axs[0].set_title("Actual vs. Predicted values")
PredictionErrorDisplay.from_predictions(
    y,
    y_pred=y_pred,
    kind="residual_vs_predicted",
    subsample=100,
    ax=axs[1],
    random_state=0,
)
axs[1].set_title("Residuals vs. Predicted Values")
fig.suptitle("Plotting cross-validated predictions")
plt.tight_layout()
plt.show()
It is important to note that we used
cross_val_predict for visualization
purpose only in this example.
It would be problematic to
quantitatively assess the model performance by computing a single
performance metric from the concatenated predictions returned by
cross_val_predict
when the different CV folds vary by size and distributions.
It is recommended to compute per-fold performance metrics using:
cross_val_score or
cross_validate instead.
Total running time of the script: (0 minutes 0.191 seconds)
Related examples
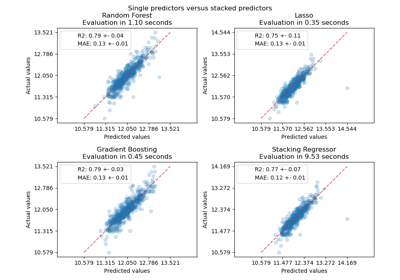
Effect of transforming the targets in regression model
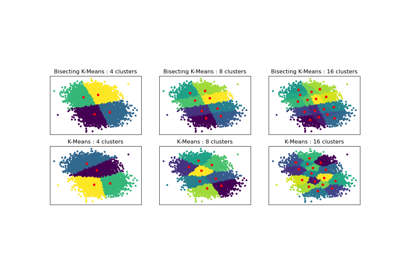
Bisecting K-Means and Regular K-Means Performance Comparison