Logistic Regression 3-class Classifier#
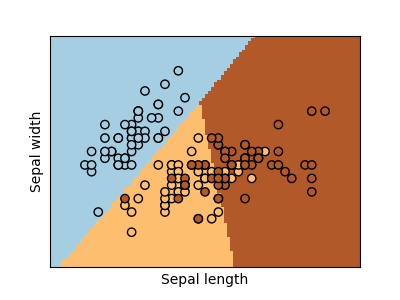
Show below is a logistic-regression classifiers decision boundaries on the first two dimensions (sepal length and width) of the iris dataset. The datapoints are colored according to their labels.
# Code source: Gaël Varoquaux
# Modified for documentation by Jaques Grobler
# License: BSD 3 clause

import matplotlib.pyplot as plt

from sklearn import datasets
from sklearn.inspection import DecisionBoundaryDisplay
from sklearn.linear_model import LogisticRegression

# import some data to play with
iris = datasets.load_iris()
X = iris.data[:, :2]  # we only take the first two features.
Y = iris.target

# Create an instance of Logistic Regression Classifier and fit the data.
logreg = LogisticRegression(C=1e5)
logreg.fit(X, Y)

_, ax = plt.subplots(figsize=(4, 3))
DecisionBoundaryDisplay.from_estimator(
    logreg,
    X,
    cmap=plt.cm.Paired,
    ax=ax,
    response_method="predict",
    plot_method="pcolormesh",
    shading="auto",
    xlabel="Sepal length",
    ylabel="Sepal width",
    eps=0.5,
)

# Plot also the training points
plt.scatter(X[:, 0], X[:, 1], c=Y, edgecolors="k", cmap=plt.cm.Paired)


plt.xticks(())
plt.yticks(())

plt.show()
Total running time of the script: (0 minutes 0.048 seconds)
Related examples
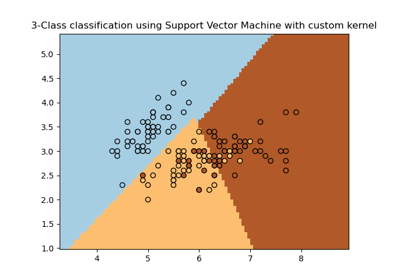
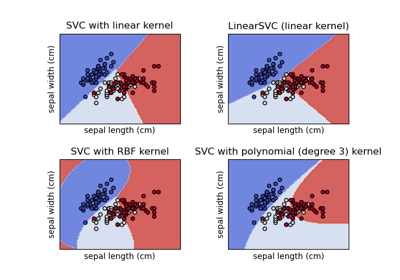
Plot different SVM classifiers in the iris dataset
Plot different SVM classifiers in the iris dataset
Plot the decision surface of decision trees trained on the iris dataset
Plot the decision surface of decision trees trained on the iris dataset