OOB Errors for Random Forests#
The RandomForestClassifier is trained using bootstrap aggregation, where
each new tree is fit from a bootstrap sample of the training observations
\(z_i = (x_i, y_i)\). The out-of-bag (OOB) error is the average error for
each \(z_i\) calculated using predictions from the trees that do not
contain \(z_i\) in their respective bootstrap sample. This allows the
RandomForestClassifier to be fit and validated whilst being trained [1].
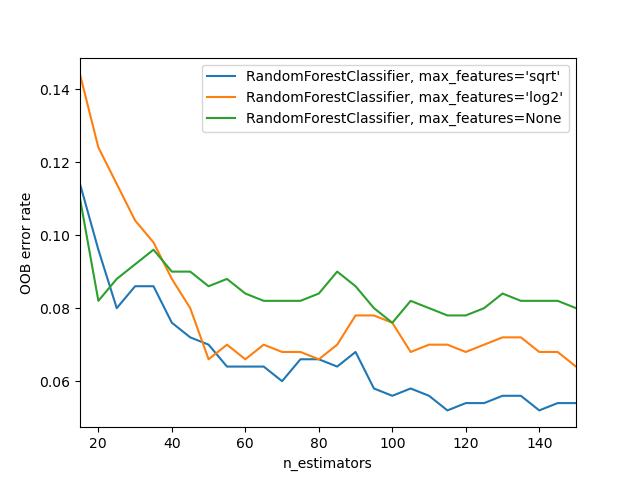
The example below demonstrates how the OOB error can be measured at the
addition of each new tree during training. The resulting plot allows a
practitioner to approximate a suitable value of n_estimators at which the
error stabilizes.
# Author: Kian Ho <hui.kian.ho@gmail.com>
#         Gilles Louppe <g.louppe@gmail.com>
#         Andreas Mueller <amueller@ais.uni-bonn.de>
#
# License: BSD 3 Clause

from collections import OrderedDict

import matplotlib.pyplot as plt

from sklearn.datasets import make_classification
from sklearn.ensemble import RandomForestClassifier

RANDOM_STATE = 123

# Generate a binary classification dataset.
X, y = make_classification(
    n_samples=500,
    n_features=25,
    n_clusters_per_class=1,
    n_informative=15,
    random_state=RANDOM_STATE,
)

# NOTE: Setting the `warm_start` construction parameter to `True` disables
# support for parallelized ensembles but is necessary for tracking the OOB
# error trajectory during training.
ensemble_clfs = [
    (
        "RandomForestClassifier, max_features='sqrt'",
        RandomForestClassifier(
            warm_start=True,
            oob_score=True,
            max_features="sqrt",
            random_state=RANDOM_STATE,
        ),
    ),
    (
        "RandomForestClassifier, max_features='log2'",
        RandomForestClassifier(
            warm_start=True,
            max_features="log2",
            oob_score=True,
            random_state=RANDOM_STATE,
        ),
    ),
    (
        "RandomForestClassifier, max_features=None",
        RandomForestClassifier(
            warm_start=True,
            max_features=None,
            oob_score=True,
            random_state=RANDOM_STATE,
        ),
    ),
]

# Map a classifier name to a list of (<n_estimators>, <error rate>) pairs.
error_rate = OrderedDict((label, []) for label, _ in ensemble_clfs)

# Range of `n_estimators` values to explore.
min_estimators = 15
max_estimators = 150

for label, clf in ensemble_clfs:
    for i in range(min_estimators, max_estimators + 1, 5):
        clf.set_params(n_estimators=i)
        clf.fit(X, y)

        # Record the OOB error for each `n_estimators=i` setting.
        oob_error = 1 - clf.oob_score_
        error_rate[label].append((i, oob_error))

# Generate the "OOB error rate" vs. "n_estimators" plot.
for label, clf_err in error_rate.items():
    xs, ys = zip(*clf_err)
    plt.plot(xs, ys, label=label)

plt.xlim(min_estimators, max_estimators)
plt.xlabel("n_estimators")
plt.ylabel("OOB error rate")
plt.legend(loc="upper right")
plt.show()
Total running time of the script: (0 minutes 3.901 seconds)
Related examples
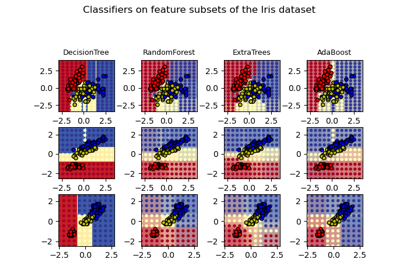
Plot the decision surfaces of ensembles of trees on the iris dataset