
Examples
General examples
General-purpose and introductory examples for the scikit.

Simple usage of Pipeline that runs successively a univariate feature selection with anova and t...
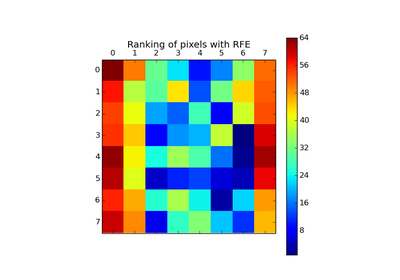
A recursive feature elimination example showing the relevance of pixels in a digit classificati...
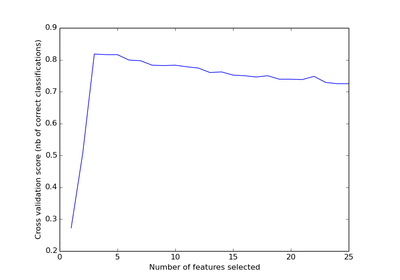
A recursive feature elimination example with automatic tuning of the number of features selecte...
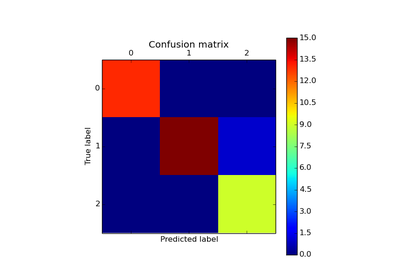
Example of confusion matrix usage to evaluate the quality of the output of a classifier on the ...
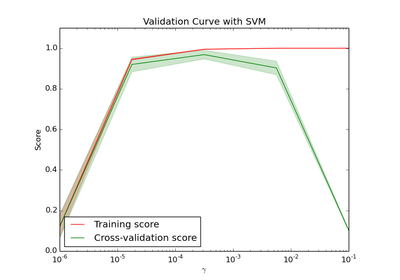
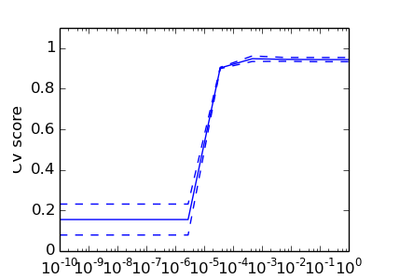
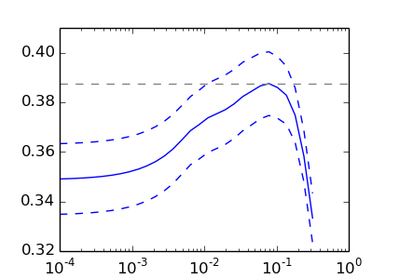
In this plot you can see the training scores and validation scores of an SVM for different valu...
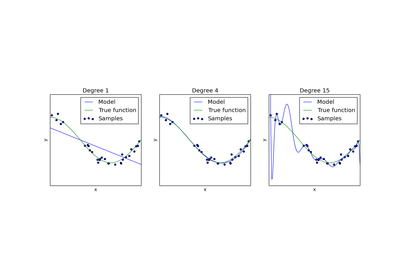
This example demonstrates the problems of underfitting and overfitting and how we can use linea...

In many real-world examples, there are many ways to extract features from a dataset. Often it i...
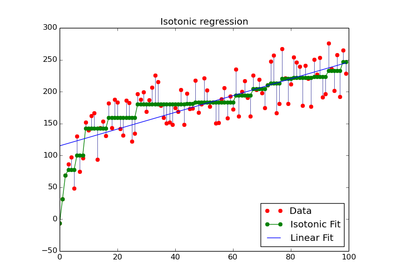
An illustration of the isotonic regression on generated data. The isotonic regression finds a n...

This example shows that imputing the missing values can give better results than discarding the...
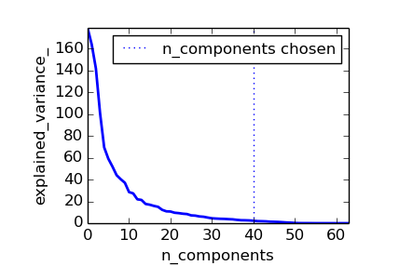
The PCA does an unsupervised dimensionality reduction, while the logistic regression does the p...
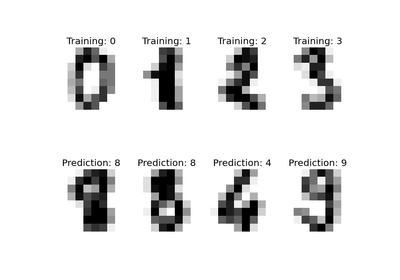
An example showing how the scikit-learn can be used to recognize images of hand-written digits.
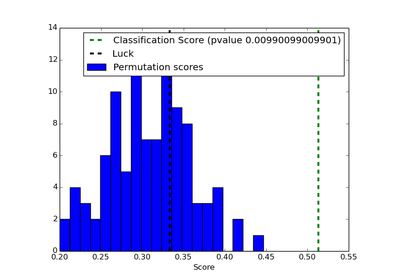
In order to test if a classification score is significative a technique in repeating the classi...

This examples shows how a classifier is optimized by cross-validation, which is done using the ...
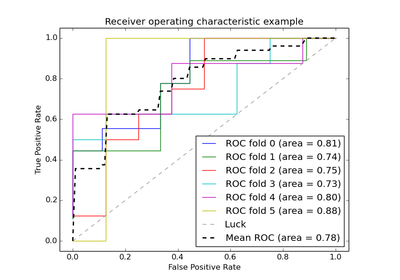
Example of Receiver Operating Characteristic (ROC) metric to evaluate classifier output quality...
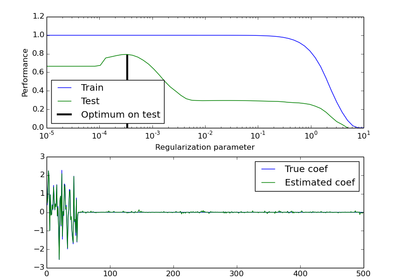
Illustration of how the performance of an estimator on unseen data (test data) is not the same ...
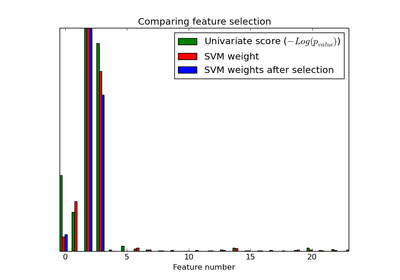
An example showing univariate feature selection.
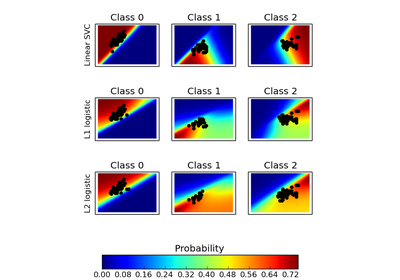
Plot the classification probability for different classifiers. We use a 3 class dataset, and we...

Compare randomized search and grid search for optimizing hyperparameters of a random forest. Al...
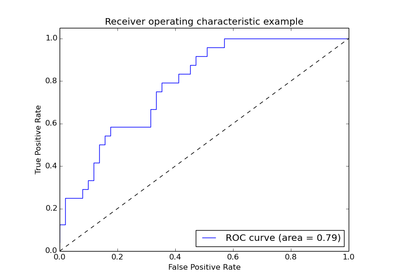
Example of Receiver Operating Characteristic (ROC) metric to evaluate classifier output quality...
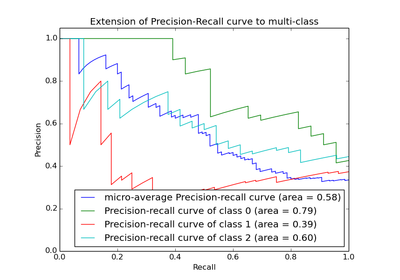
Example of Precision-Recall metric to evaluate classifier output quality.
This example simulates a multi-label document classification problem. The dataset is generated ...
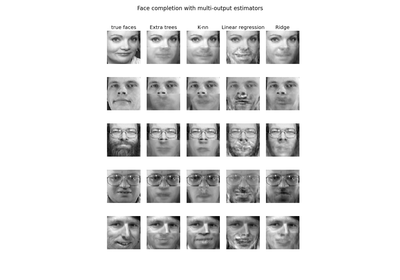
This example shows the use of multi-output estimator to complete images. The goal is to predict...

The dataset used in this example is the 20 newsgroups dataset which will be automatically downl...
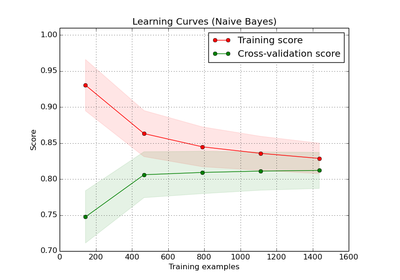
On the left side the learning curve of a naive Bayes classifier is shown for the digits dataset...

Compares FeatureHasher and DictVectorizer by using both to vectorize text documents.
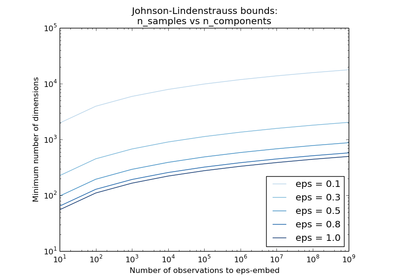
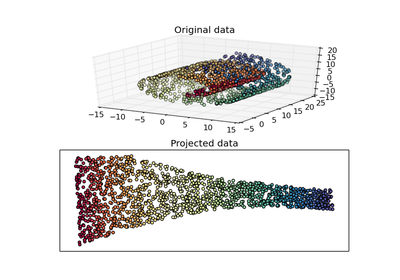
The `Johnson-Lindenstrauss lemma`_ states that any high dimensional dataset can be randomly pr...
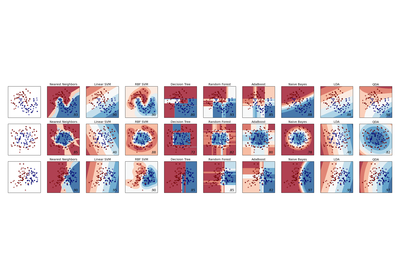
A comparison of a several classifiers in scikit-learn on synthetic datasets. The point of this ...
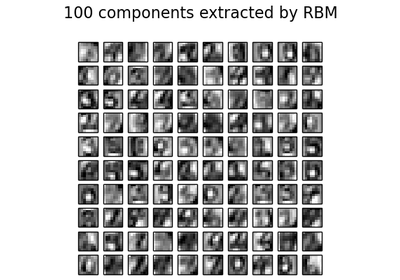
For greyscale image data where pixel values can be interpreted as degrees of blackness on a whi...
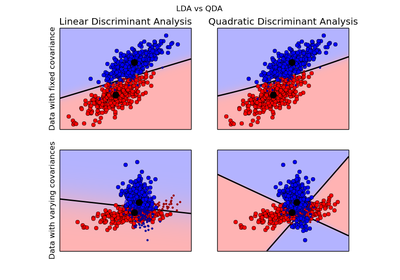
Plot the confidence ellipsoids of each class and decision boundary

This is an example showing how the scikit-learn can be used to cluster documents by topics usin...
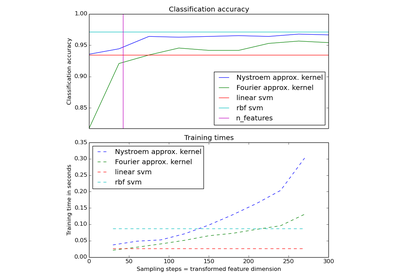
An example illustrating the approximation of the feature map of an RBF kernel.

This is an example showing how scikit-learn can be used to classify documents by topics using a...
Examples based on real world datasets
Applications to real world problems with some medium sized datasets or interactive user interface.

This is a proof of concept application of Non Negative Matrix Factorization of the term frequen...
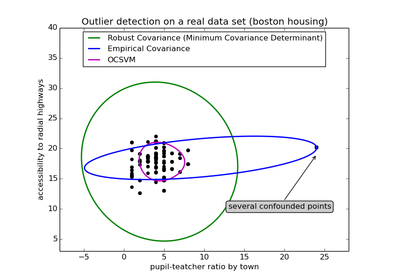
This example illustrates the need for robust covariance estimation on a real data set. It is us...
This example shows the reconstruction of an image from a set of parallel projections, acquired ...

The dataset used in this example is a preprocessed excerpt of the "Labeled Faces in the Wild", ...
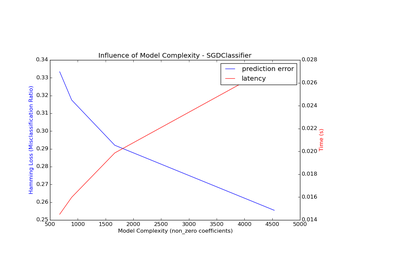
Demonstrate how model complexity influences both prediction accuracy and computational performa...
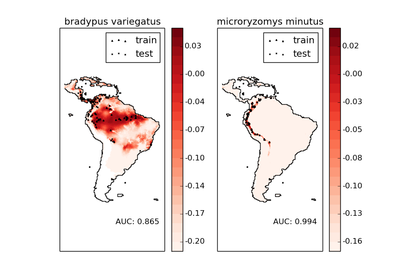
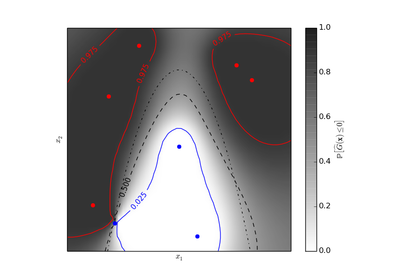
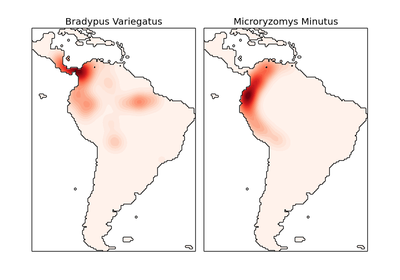
Modeling species' geographic distributions is an important problem in conservation biology. In ...
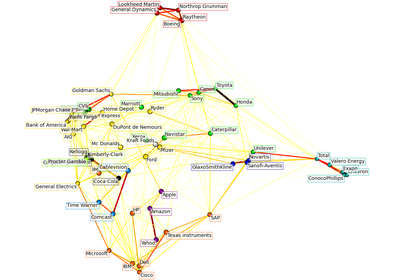
This example employs several unsupervised learning techniques to extract the stock market struc...

A classical way to assert the relative importance of vertices in a graph is to compute the prin...
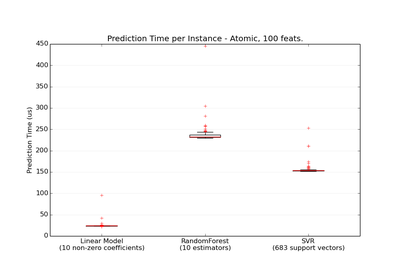
This is an example showing the prediction latency of various scikit-learn estimators.

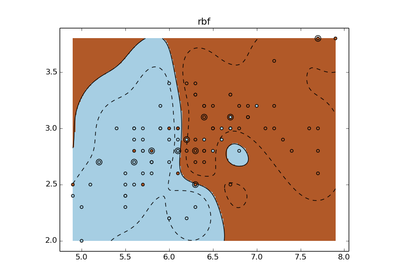
A simple graphical frontend for Libsvm mainly intended for didactic purposes. You can create da...
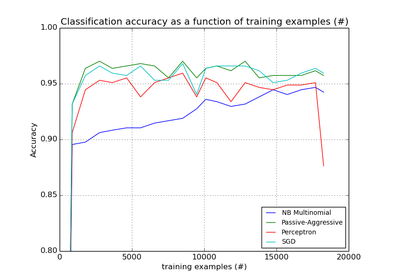
This is an example showing how scikit-learn can be used for classification using an out-of-core...
Biclustering
Examples concerning the sklearn.cluster.bicluster package.
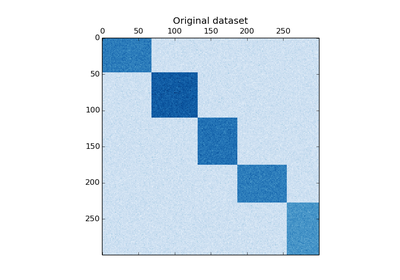
This example demonstrates how to generate a dataset and bicluster it using the the Spectral Co-...
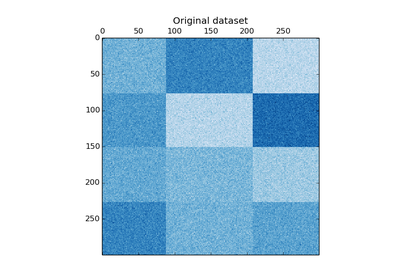
This example demonstrates how to generate a checkerboard dataset and bicluster it using the Spe...

This example demonstrates the Spectral Co-clustering algorithm on the twenty newsgroups dataset...
Clustering
Examples concerning the sklearn.cluster package.
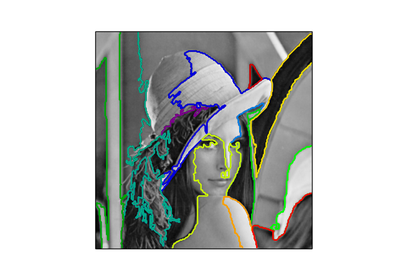
Compute the segmentation of a 2D image with Ward hierarchical clustering. The clustering is spa...
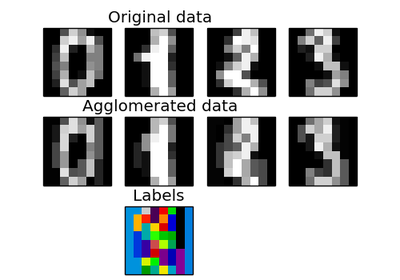
These images how similar features are merged together using feature agglomeration.
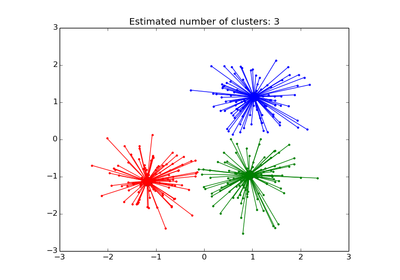
Reference: Brendan J. Frey and Delbert Dueck, "Clustering by Passing Messages Between Data Poin...
This example shows the effect of imposing a connectivity graph to capture local structure in th...
This example uses :ref:`spectral_clustering` on a graph created from voxel-to-voxel difference ...
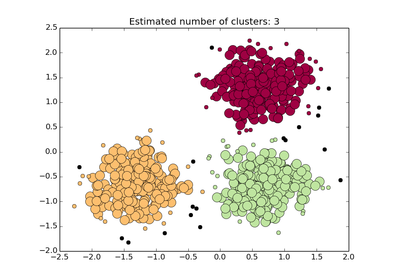
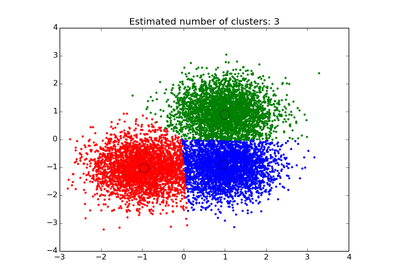
Finds core samples of high density and expands clusters from them.
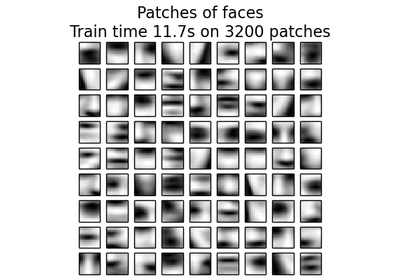
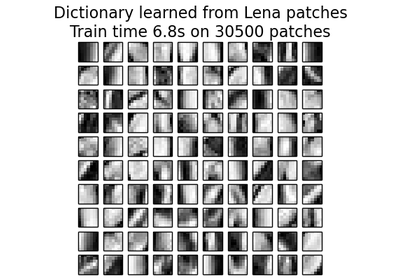
This example uses a large dataset of faces to learn a set of 20 x 20 images patches that consti...
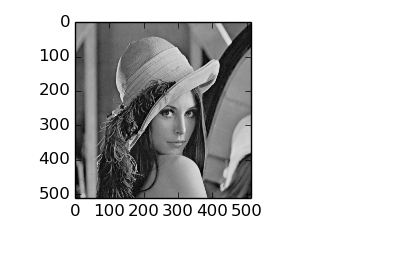
The classic image processing example, Lena, an 8-bit grayscale bit-depth, 512 x 512 sized image...
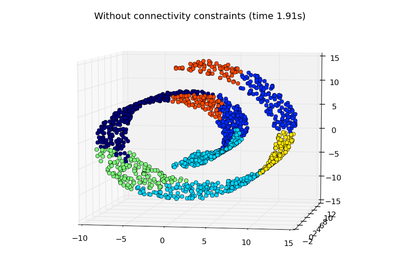
Example builds a swiss roll dataset and runs hierarchical clustering on their position.
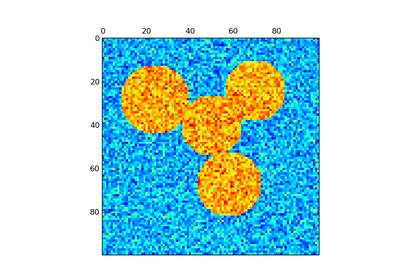
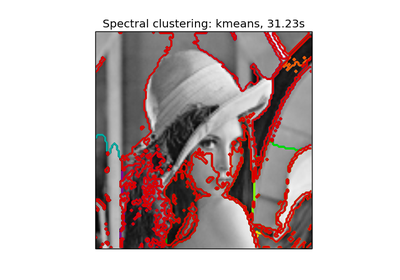
In this example, an image with connected circles is generated and spectral clustering is used t...
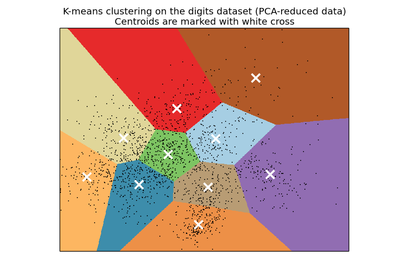
The plots display firstly what a K-means algorithm would yield using three clusters. It is then...
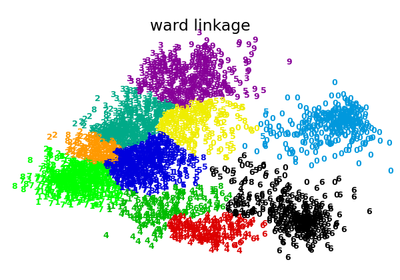
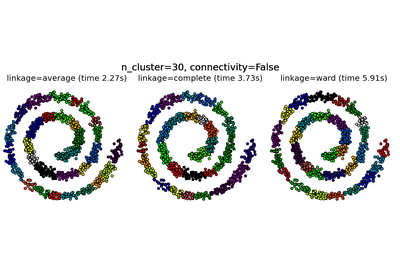
An illustration of various linkage option for agglomerative clustering on a 2D embedding of the...
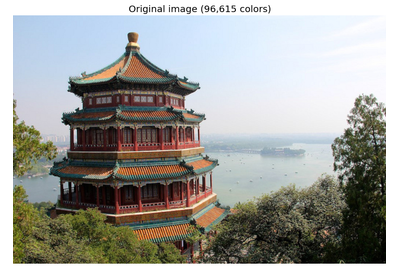
Performs a pixel-wise Vector Quantization (VQ) of an image of the summer palace (China), reduci...
This example compares 2 dimensionality reduction strategies:
Demonstrates the effect of different metrics on the hierarchical clustering.
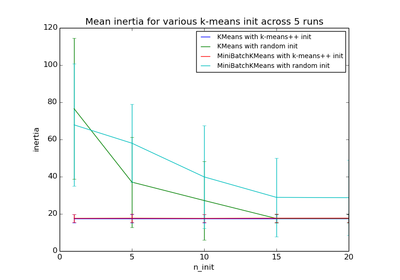
Evaluate the ability of k-means initializations strategies to make the algorithm convergence ro...
In this example we compare the various initialization strategies for K-means in terms of runtim...
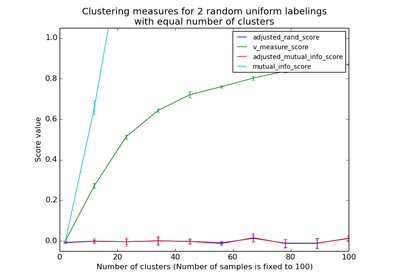
The following plots demonstrate the impact of the number of clusters and number of samples on v...
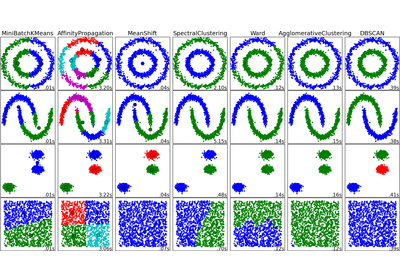
This example aims at showing characteristics of different clustering algorithms on datasets tha...
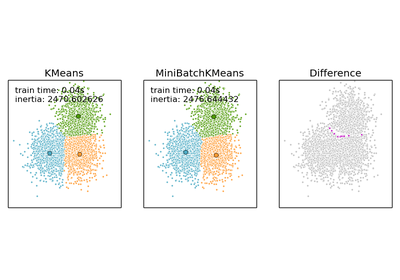
We want to compare the performance of the MiniBatchKMeans and KMeans: the MiniBatchKMeans is fa...
Covariance estimation
Examples concerning the sklearn.covariance package.
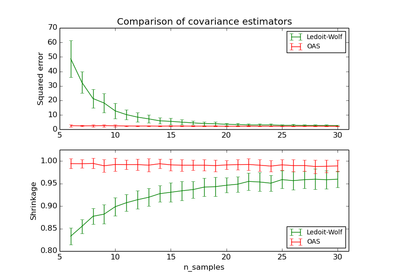
The usual covariance maximum likelihood estimate can be regularized using shrinkage. Ledoit and...
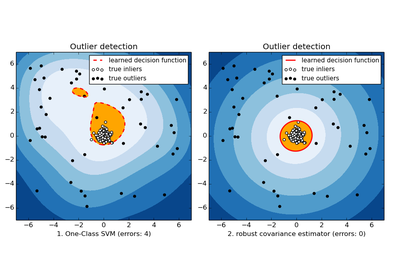
When the amount of contamination is known, this example illustrates two different ways of perfo...
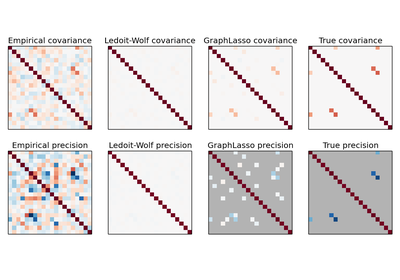
Using the GraphLasso estimator to learn a covariance and sparse precision from a small number o...
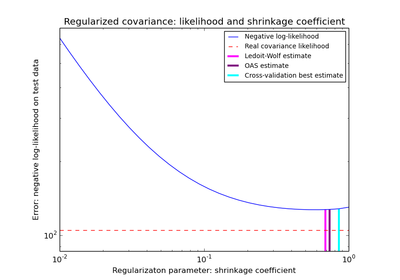
When working with covariance estimation, the usual approach is to use a maximum likelihood esti...
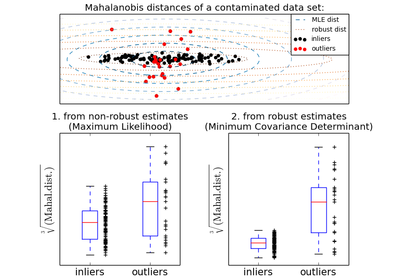
An example to show covariance estimation with the Mahalanobis distances on Gaussian distributed...
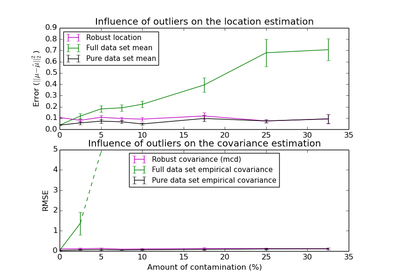
The usual covariance maximum likelihood estimate is very sensitive to the presence of outliers ...
Cross decomposition
Examples concerning the sklearn.cross_decomposition package.
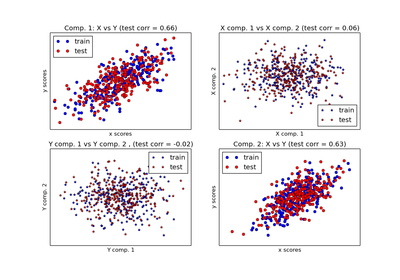
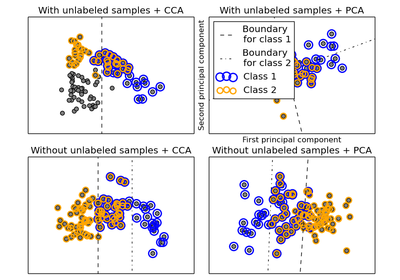
Simple usage of various cross decomposition algorithms: - PLSCanonical - PLSRegression, with mu...
Dataset examples
Examples concerning the sklearn.datasets package.
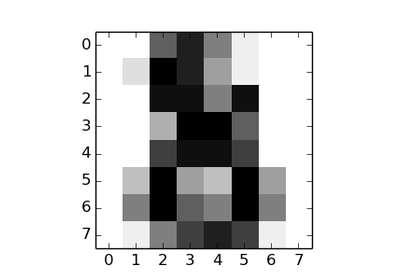
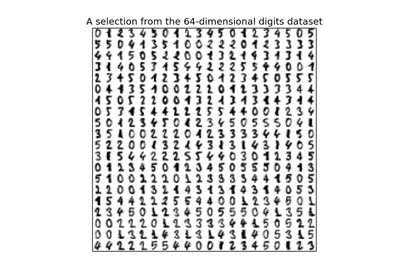
This dataset is made up of 1797 8x8 images. Each image, like the one shown below, is of a hand-...
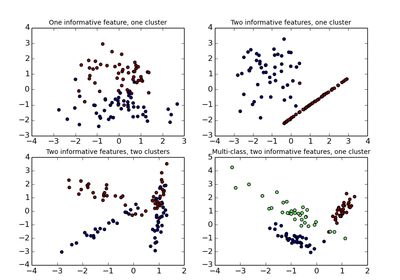
Plot several randomly generated 2D classification datasets. This example illustrates the `datas...
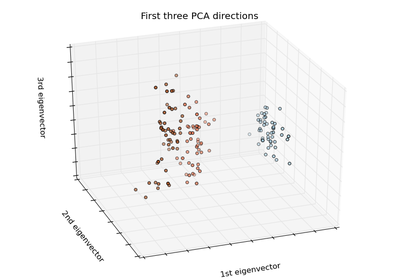
The rows being the samples and the columns being: Sepal Length, Sepal Width, Petal Length and P...
Decomposition
Examples concerning the sklearn.decomposition package.
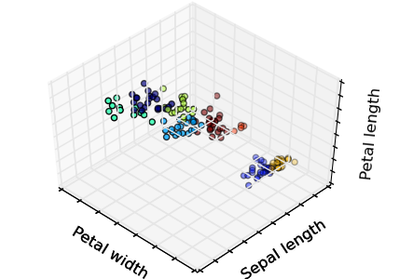
The Iris dataset represents 3 kind of Iris flowers (Setosa, Versicolour and Virginica) with 4 a...
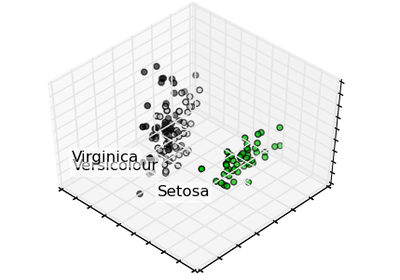
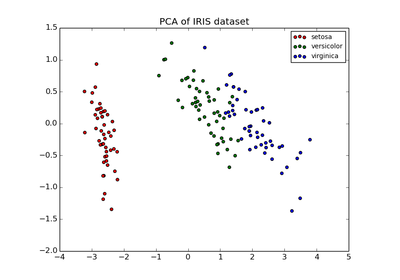
Principal Component Analysis applied to the Iris dataset.
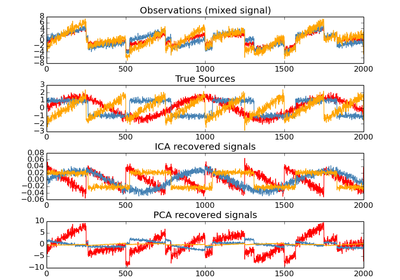
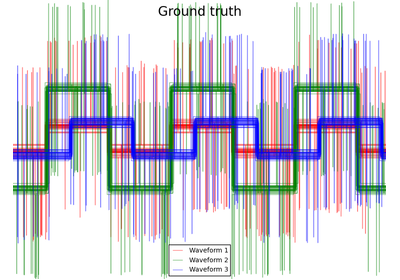
An example of estimating sources from noisy data.
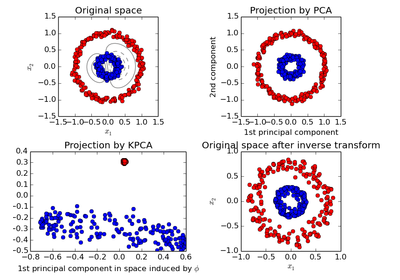
This example shows that Kernel PCA is able to find a projection of the data that makes data lin...
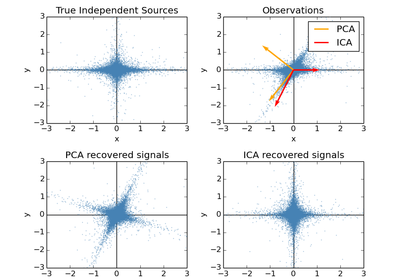
This example illustrates visually in the feature space a comparison by results using two differ...
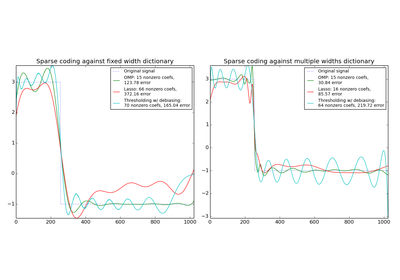
Transform a signal as a sparse combination of Ricker wavelets. This example visually compares d...
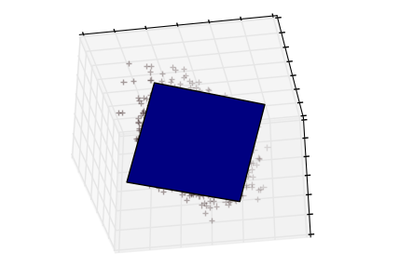
These figures aid in illustrating how a point cloud can be very flat in one direction--which is...
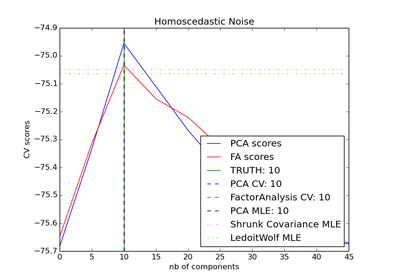
Probabilistic PCA and Factor Analysis are probabilistic models. The consequence is that the lik...
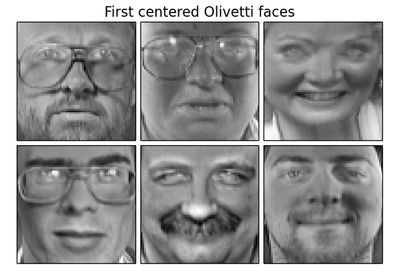
This example applies to :ref:`olivetti_faces` different unsupervised matrix decomposition (dime...
An example comparing the effect of reconstructing noisy fragments of the Lena image using first...
Ensemble methods
Examples concerning the sklearn.ensemble package.
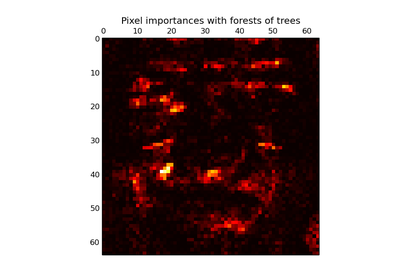
This example shows the use of forests of trees to evaluate the importance of the pixels in an i...
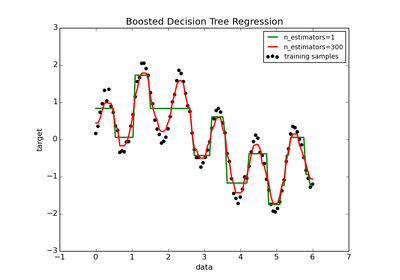
A decision tree is boosted using the AdaBoost.R2 [1] algorithm on a 1D sinusoidal dataset with ...
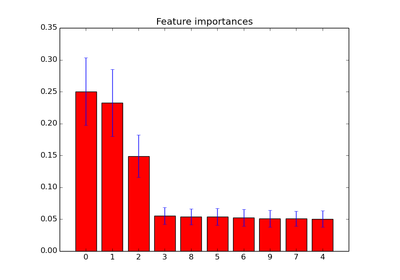
This examples shows the use of forests of trees to evaluate the importance of features on an ar...
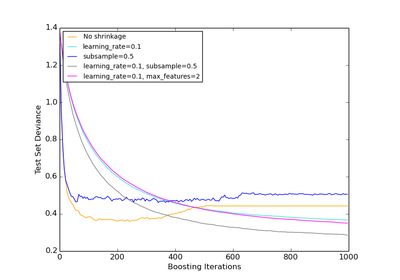
Illustration of the effect of different regularization strategies for Gradient Boosting. The ex...
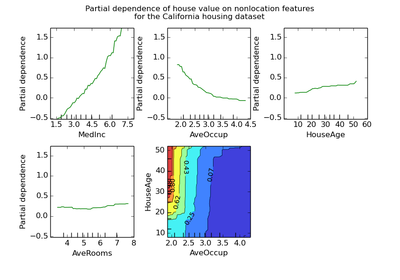
Partial dependence plots show the dependence between the target function [1]_ and a set of 'tar...
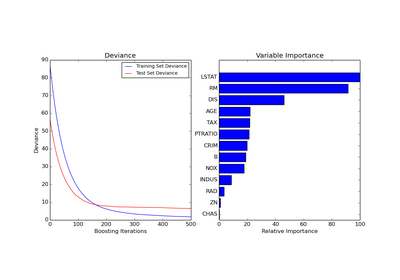
Demonstrate Gradient Boosting on the boston housing dataset.
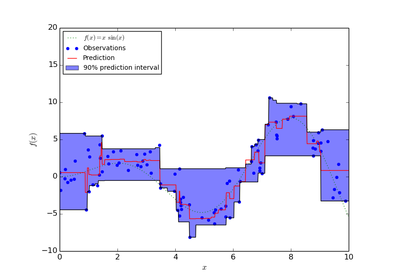
This example shows how quantile regression can be used to create prediction intervals.
This example fits an AdaBoosted decision stump on a non-linearly separable classification datas...
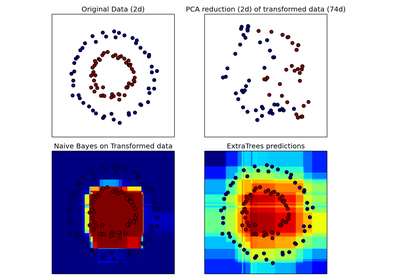
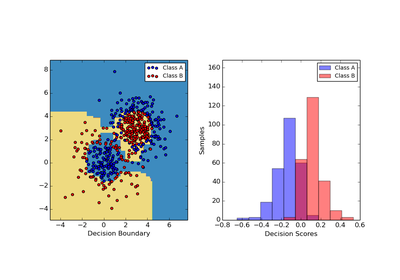
RandomTreesEmbedding provides a way to map data to a very high-dimensional, sparse representati...
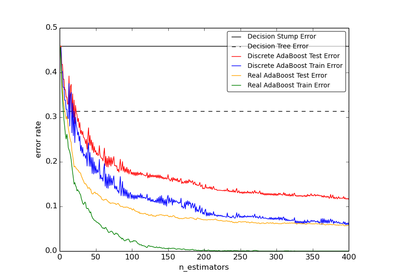
This example is based on Figure 10.2 from Hastie et al 2009 [1] and illustrates the difference ...
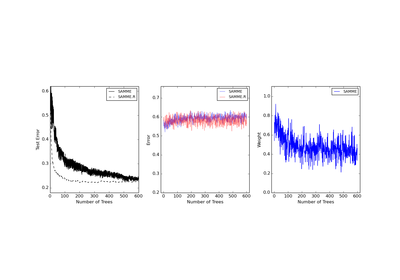
This example reproduces Figure 1 of Zhu et al [1] and shows how boosting can improve prediction...
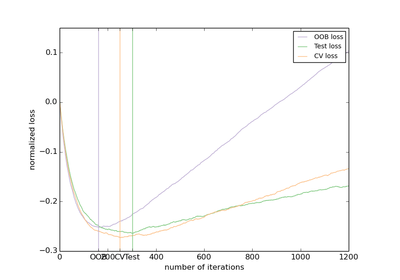
Out-of-bag (OOB) estimates can be a useful heuristic to estimate the "optimal" number of boosti...
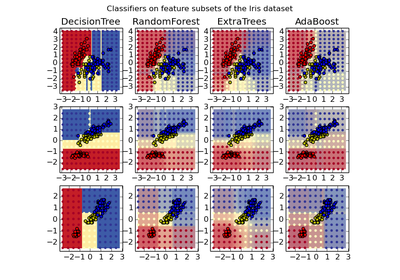
Plot the decision surfaces of forests of randomized trees trained on pairs of features of the i...
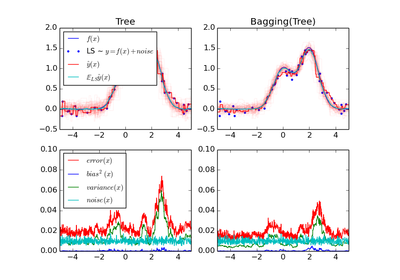
This example illustrates and compares the bias-variance decomposition of the expected mean squa...
Tutorial exercises
Exercises for the tutorials

A tutorial exercise regarding the use of classification techniques on the Digits dataset.
A tutorial excercise using Cross-validation with an SVM on the Digits dataset.
A tutorial exercise for using different SVM kernels.
A tutorial excercise which uses cross-validation with linear models.
Gaussian Process for Machine Learning
Examples concerning the sklearn.gaussian_process package.

This example consists in fitting a Gaussian Process model onto the diabetes dataset.
A two-dimensional regression exercise with a post-processing allowing for probabilistic classif...
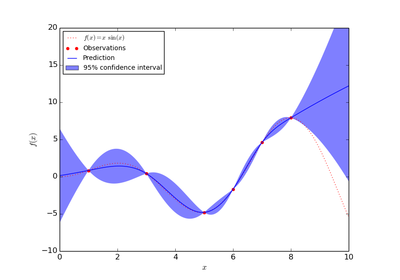
A simple one-dimensional regression exercise computed in two different ways:
Generalized Linear Models
Examples concerning the sklearn.linear_model package.
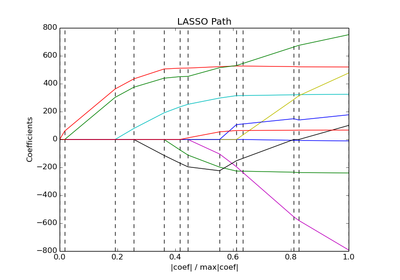
Computes Lasso Path along the regularization parameter using the LARS algorithm on the diabetes...
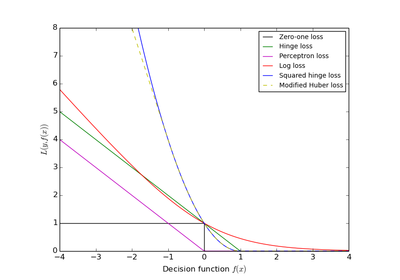
A plot that compares the various convex loss functions supported by :class:`sklearn.linear_mode...
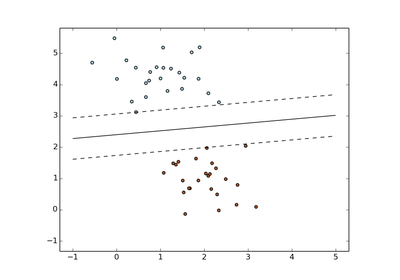
Plot the maximum margin separating hyperplane within a two-class separable dataset using a line...
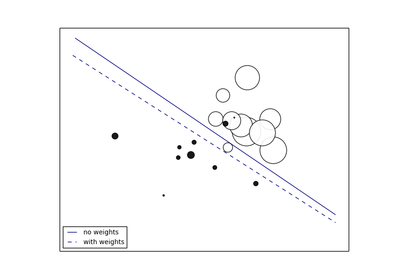
Plot decision function of a weighted dataset, where the size of points is proportional to its w...
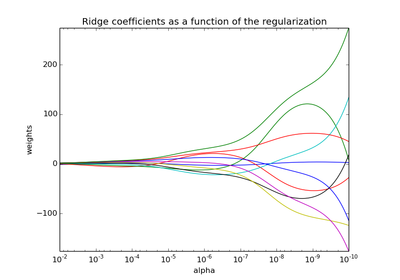
Shows the effect of collinearity in the coefficients of an estimator.
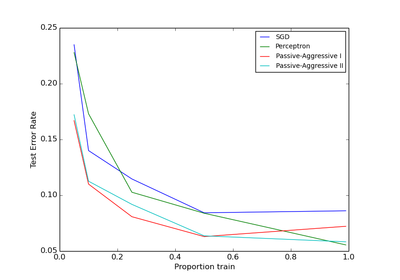
An example showing how different online solvers perform on the hand-written digits dataset.
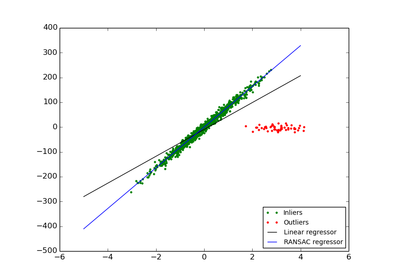
In this example we see how to robustly fit a linear model to faulty data using the RANSAC algor...
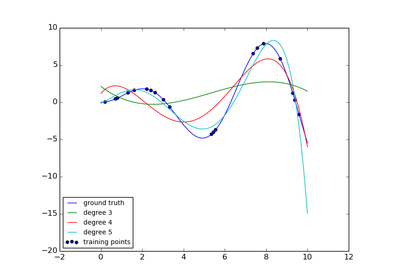
This example demonstrates how to approximate a function with a polynomial of degree n_degree by...
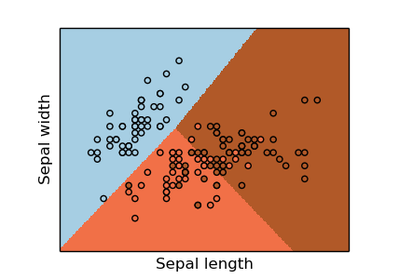
Show below is a logistic-regression classifiers decision boundaries on the `iris
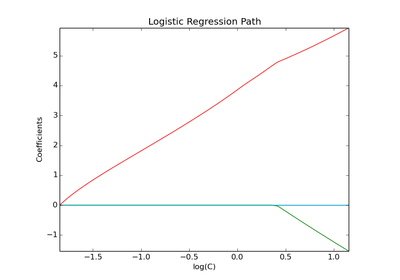
Computes path on IRIS dataset.
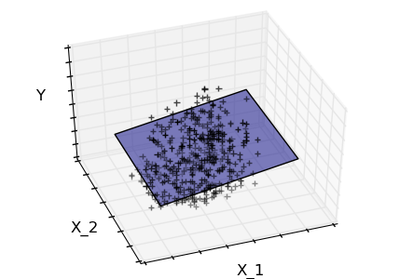
Ridge regression is basically minimizing a penalised version of the least-squared function. The...
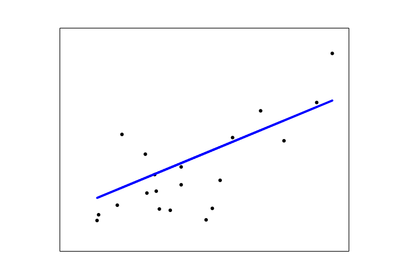
The coefficients, the residual sum of squares and the variance score are also calculated.
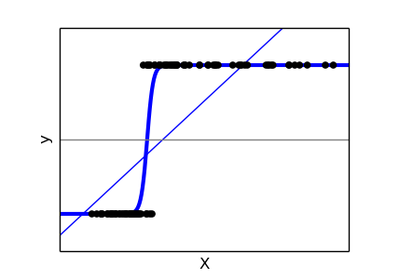
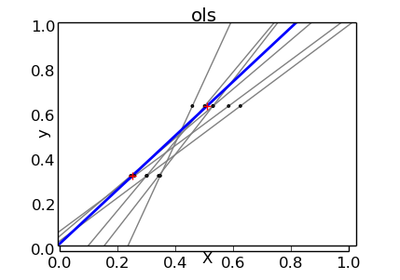
Show in the plot is how the logistic regression would, in this synthetic dataset, classify valu...
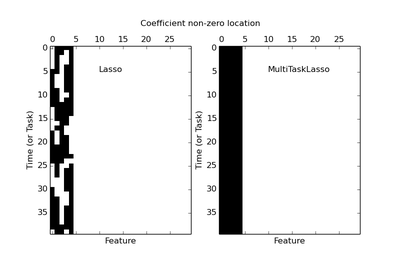
The multi-task lasso allows to fit multiple regression problems jointly enforcing the selected ...
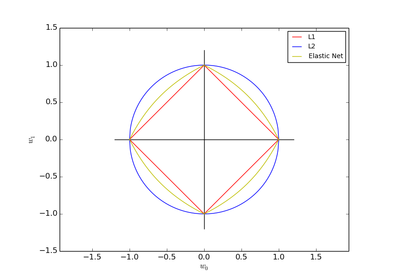
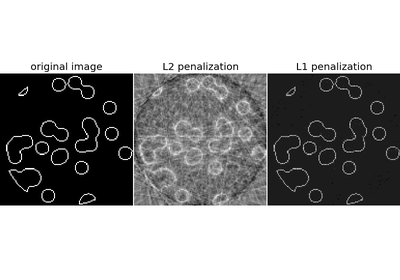
Plot the contours of the three penalties.

We show that linear_model.Lasso provides the same results for dense and sparse data and that in...
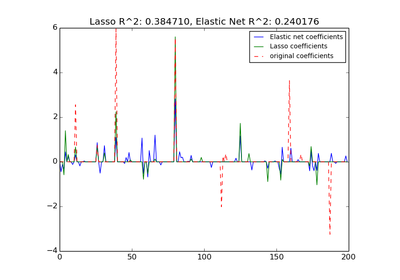
Estimates Lasso and Elastic-Net regression models on a manually generated sparse signal corrupt...
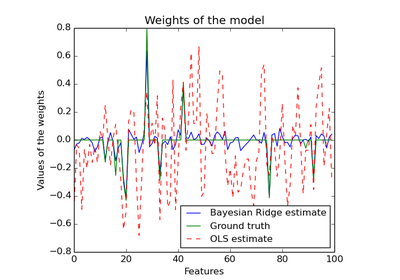
Computes a Bayesian Ridge Regression on a synthetic dataset.
Features 1 and 2 of the diabetes-dataset are fitted and plotted below. It illustrates that alth...
Fit regression model with Bayesian Ridge Regression.
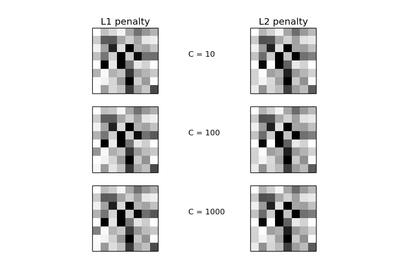
Comparison of the sparsity (percentage of zero coefficients) of solutions when L1 and L2 penalt...
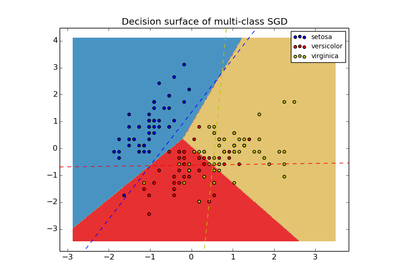
Plot decision surface of multi-class SGD on iris dataset. The hyperplanes corresponding to the ...
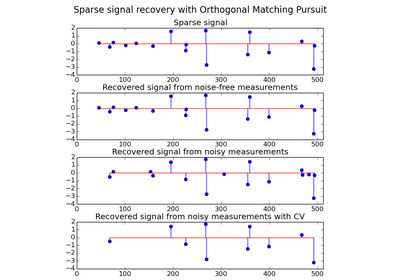
Using orthogonal matching pursuit for recovering a sparse signal from a noisy measurement encod...
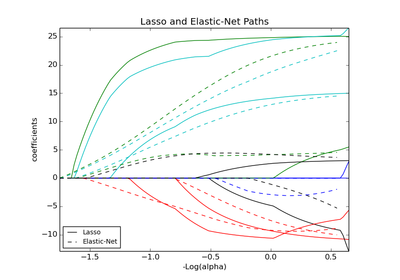
Lasso and elastic net (L1 and L2 penalisation) implemented using a coordinate descent.
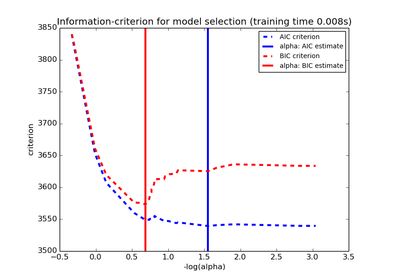
Use the Akaike information criterion (AIC), the Bayes Information criterion (BIC) and cross-val...
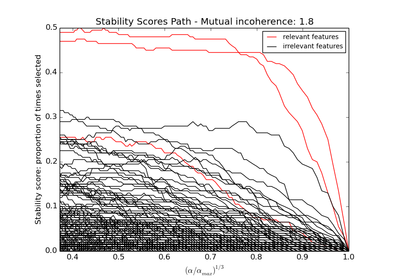
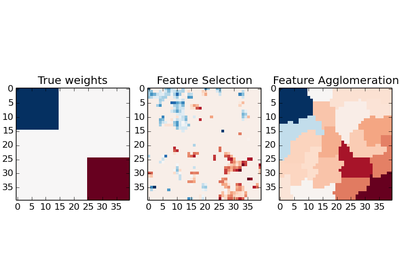
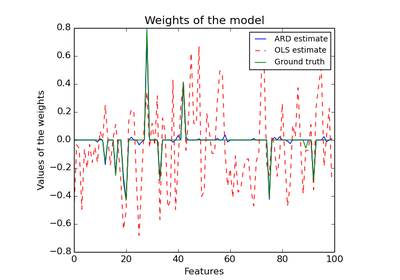
Given a small number of observations, we want to recover which features of X are relevant to ex...
Manifold learning
Examples concerning the sklearn.manifold package.
An illustration of Swiss Roll reduction with locally linear embedding
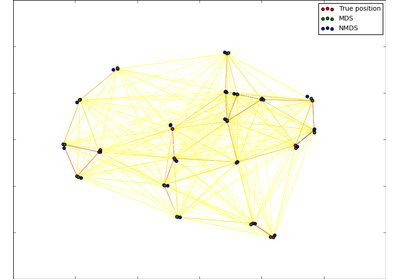
An illustration of the metric and non-metric MDS on generated noisy data.
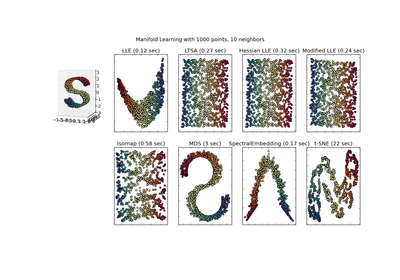
An illustration of dimensionality reduction on the S-curve dataset with various manifold learni...
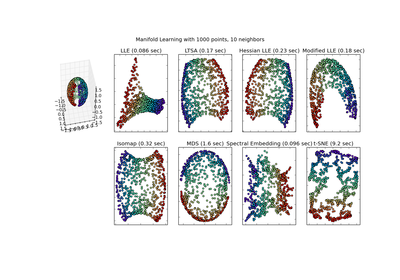
An application of the different :ref:`manifold` techniques on a spherical data-set. Here one ca...
An illustration of various embeddings on the digits dataset.
Gaussian Mixture Models
Examples concerning the sklearn.mixture package.
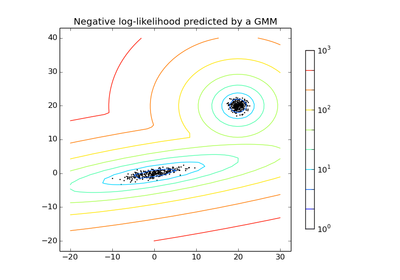
Plot the density estimation of a mixture of two Gaussians. Data is generated from two Gaussians...
Plot the confidence ellipsoids of a mixture of two Gaussians with EM and variational Dirichlet ...
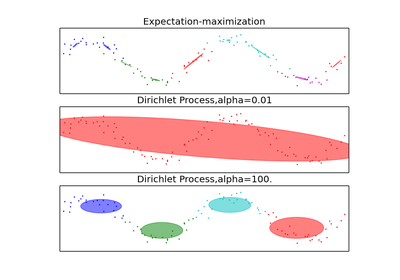
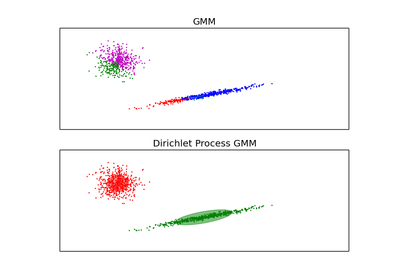
This example highlights the advantages of the Dirichlet Process: complexity control and dealing...
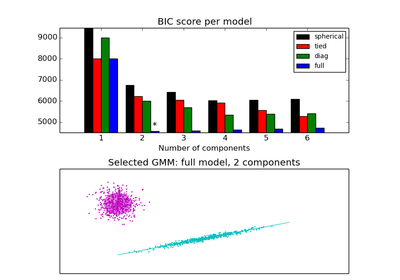
This example shows that model selection can be performed with Gaussian Mixture Models using inf...
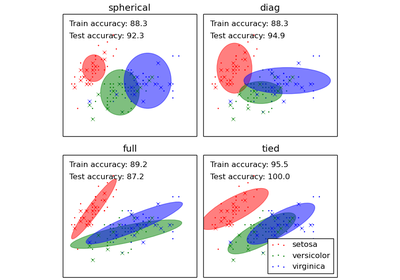
Demonstration of Gaussian mixture models for classification.
Nearest Neighbors
Examples concerning the sklearn.neighbors package.
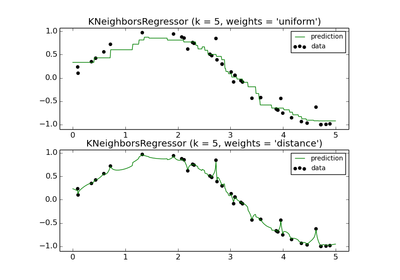
Demonstrate the resolution of a regression problem using a k-Nearest Neighbor and the interpola...
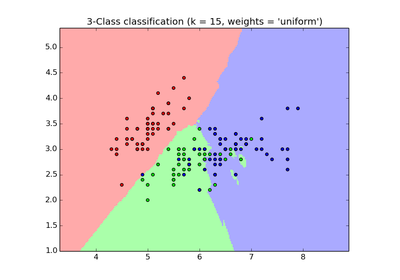
Sample usage of Nearest Neighbors classification. It will plot the decision boundaries for each...
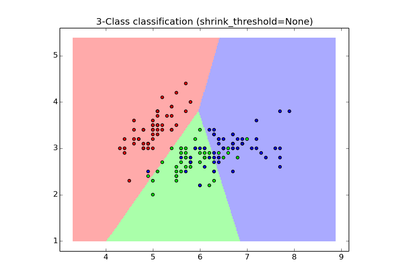
Sample usage of Nearest Centroid classification. It will plot the decision boundaries for each ...
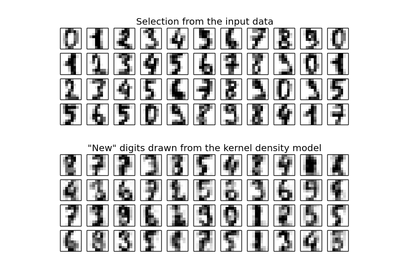
This example shows how kernel density estimation (KDE), a powerful non-parametric density estim...
This example does not perform any learning over the data (see :ref:`example_applications_plot_s...
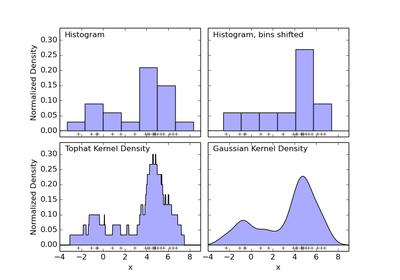
The first plot shows one of the problems with using histograms to visualize the density of poin...
Semi Supervised Classification
Examples concerning the sklearn.semi_supervised package.
Example of LabelPropagation learning a complex internal structure to demonstrate "manifold lear...

Comparison for decision boundary generated on iris dataset between Label Propagation and SVM.
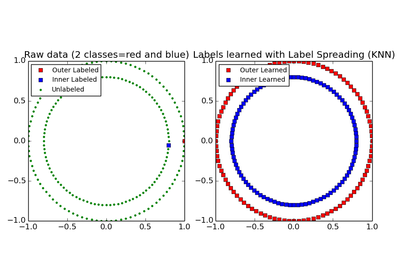
This example demonstrates the power of semisupervised learning by training a Label Spreading mo...
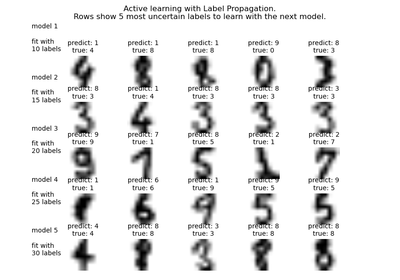
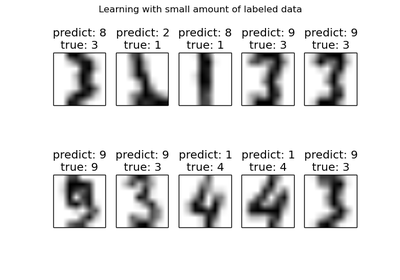
Demonstrates an active learning technique to learn handwritten digits using label propagation.
Support Vector Machines
Examples concerning the sklearn.svm package.
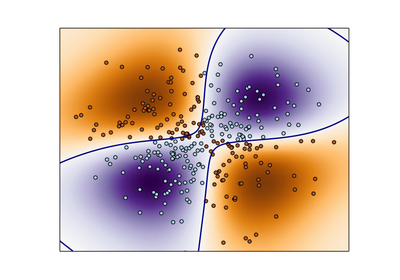
Perform binary classification using non-linear SVC with RBF kernel. The target to predict is a ...
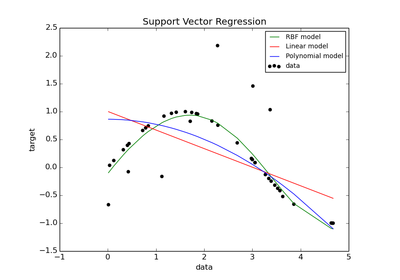
Toy example of 1D regression using linear, polynomial and RBF kernels.
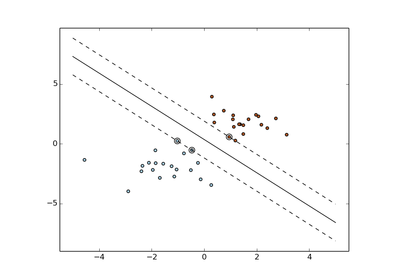
Plot the maximum margin separating hyperplane within a two-class separable dataset using a Supp...
Find the optimal separating hyperplane using an SVC for classes that are unbalanced.
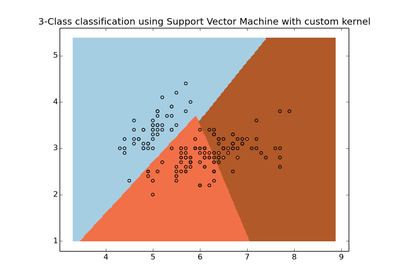
Simple usage of Support Vector Machines to classify a sample. It will plot the decision surface...
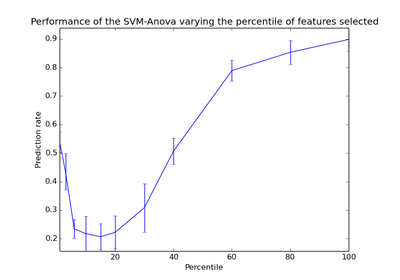
This example shows how to perform univariate feature before running a SVC (support vector class...
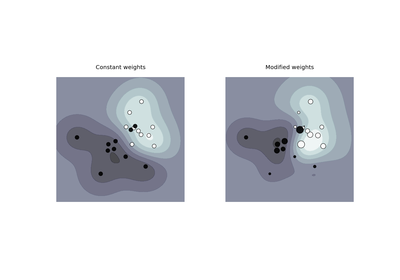
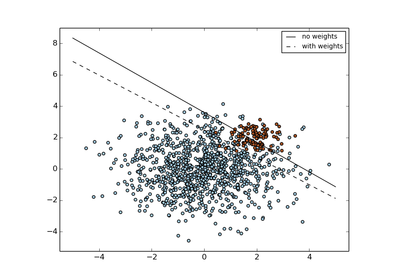
Plot decision function of a weighted dataset, where the size of points is proportional to its w...
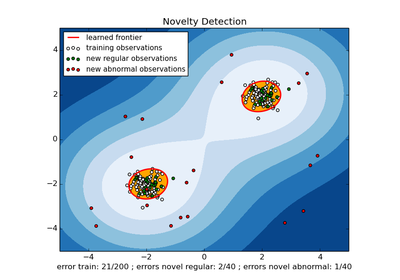
An example using a one-class SVM for novelty detection.
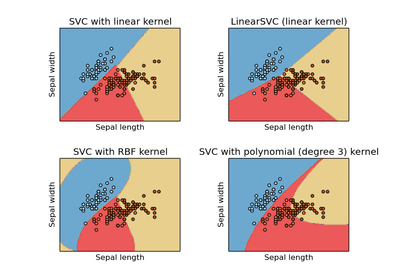
Comparison of different linear SVM classifiers on a 2D projection of the iris dataset. We only ...
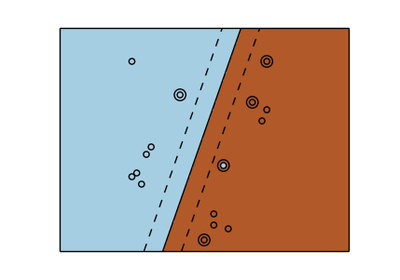
Three different types of SVM-Kernels are displayed below. The polynomial and RBF are especially...
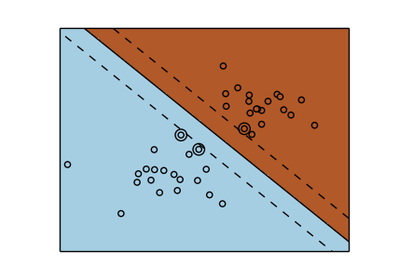
A small value of `C` includes more/all the observations, allowing the margins to be calculated ...
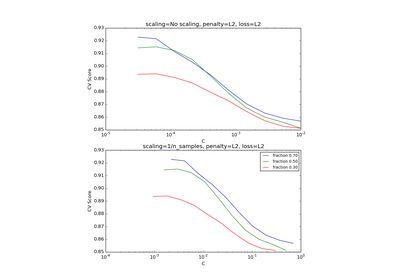
The following example illustrates the effect of scaling the regularization parameter when using...
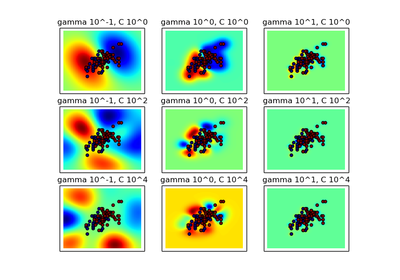
This example illustrates the effect of the parameters `gamma` and `C` of the rbf kernel SVM.
Decision Trees
Examples concerning the sklearn.tree package.
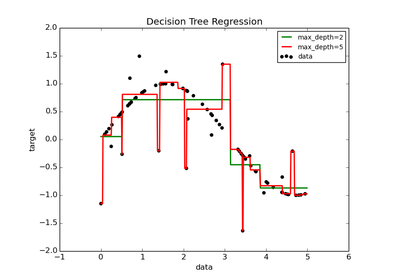
A 1D regression with decision tree.
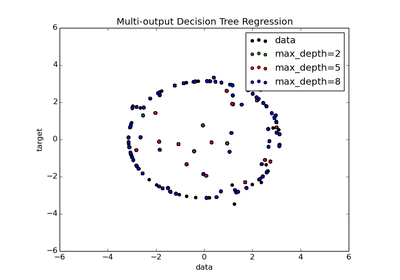
An example to illustrate multi-output regression with decision tree.
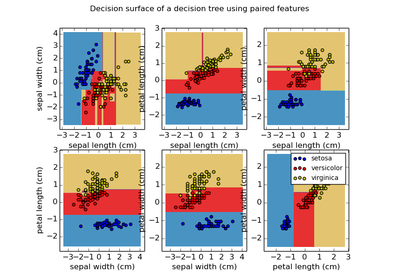
Plot the decision surface of a decision tree trained on pairs of features of the iris dataset.