
Confusion matrix
Example of confusion matrix usage to evaluate the quality of the output of a classifier on the iris data set. The diagonal elements represent the number of points for which the predicted label is equal to the true label, while off-diagonal elements are those that are mislabeled by the classifier. The higher the diagonal values of the confusion matrix the better, indicating many correct predictions.
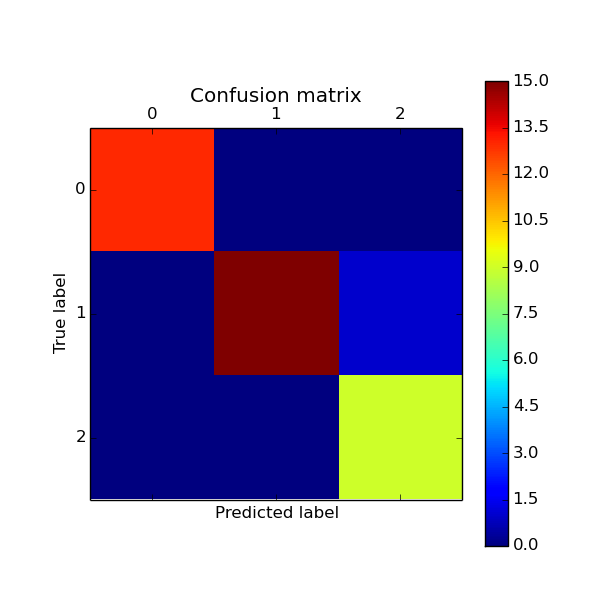
Script output:
[[13  0  0]
 [ 0 15  1]
 [ 0  0  9]]
Python source code: plot_confusion_matrix.py
print(__doc__)

from sklearn import svm, datasets
from sklearn.cross_validation import train_test_split
from sklearn.metrics import confusion_matrix

import matplotlib.pyplot as plt

# import some data to play with
iris = datasets.load_iris()
X = iris.data
y = iris.target

# Split the data into a training set and a test set
X_train, X_test, y_train, y_test = train_test_split(X, y, random_state=0)

# Run classifier
classifier = svm.SVC(kernel='linear')
y_pred = classifier.fit(X_train, y_train).predict(X_test)

# Compute confusion matrix
cm = confusion_matrix(y_test, y_pred)

print(cm)

# Show confusion matrix in a separate window
plt.matshow(cm)
plt.title('Confusion matrix')
plt.colorbar()
plt.ylabel('True label')
plt.xlabel('Predicted label')
plt.show()
Total running time of the example: 0.16 seconds ( 0 minutes 0.16 seconds)