
Label Propagation learning a complex structure
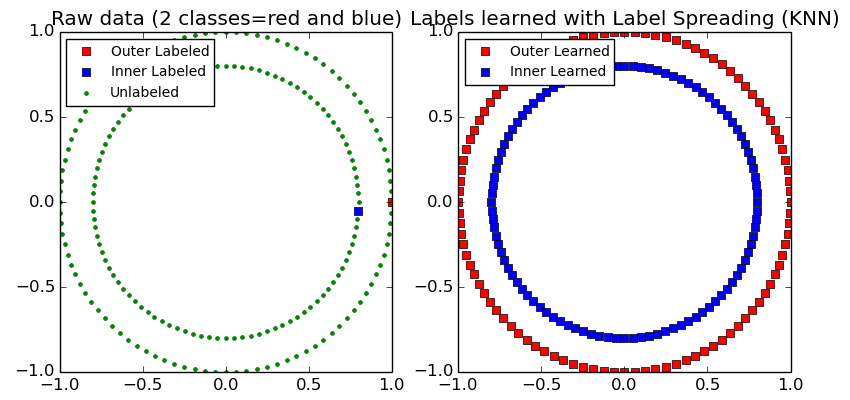
Example of LabelPropagation learning a complex internal structure to demonstrate “manifold learning”. The outer circle should be labeled “red” and the inner circle “blue”. Because both label groups lie inside their own distinct shape, we can see that the labels propagate correctly around the circle.
Python source code: plot_label_propagation_structure.py
print(__doc__)

# Authors: Clay Woolam <clay@woolam.org>
#          Andreas Mueller <amueller@ais.uni-bonn.de>
# Licence: BSD

import numpy as np
import matplotlib.pyplot as plt
from sklearn.semi_supervised import label_propagation
from sklearn.datasets import make_circles

# generate ring with inner box
n_samples = 200
X, y = make_circles(n_samples=n_samples, shuffle=False)
outer, inner = 0, 1
labels = -np.ones(n_samples)
labels[0] = outer
labels[-1] = inner

###############################################################################
# Learn with LabelSpreading
label_spread = label_propagation.LabelSpreading(kernel='knn', alpha=1.0)
label_spread.fit(X, labels)

###############################################################################
# Plot output labels
output_labels = label_spread.transduction_
plt.figure(figsize=(8.5, 4))
plt.subplot(1, 2, 1)
plot_outer_labeled, = plt.plot(X[labels == outer, 0],
                               X[labels == outer, 1], 'rs')
plot_unlabeled, = plt.plot(X[labels == -1, 0], X[labels == -1, 1], 'g.')
plot_inner_labeled, = plt.plot(X[labels == inner, 0],
                               X[labels == inner, 1], 'bs')
plt.legend((plot_outer_labeled, plot_inner_labeled, plot_unlabeled),
           ('Outer Labeled', 'Inner Labeled', 'Unlabeled'), 'upper left',
           numpoints=1, shadow=False)
plt.title("Raw data (2 classes=red and blue)")

plt.subplot(1, 2, 2)
output_label_array = np.asarray(output_labels)
outer_numbers = np.where(output_label_array == outer)[0]
inner_numbers = np.where(output_label_array == inner)[0]
plot_outer, = plt.plot(X[outer_numbers, 0], X[outer_numbers, 1], 'rs')
plot_inner, = plt.plot(X[inner_numbers, 0], X[inner_numbers, 1], 'bs')
plt.legend((plot_outer, plot_inner), ('Outer Learned', 'Inner Learned'),
           'upper left', numpoints=1, shadow=False)
plt.title("Labels learned with Label Spreading (KNN)")

plt.subplots_adjust(left=0.07, bottom=0.07, right=0.93, top=0.92)
plt.show()
Total running time of the example: 0.35 seconds ( 0 minutes 0.35 seconds)