5. Visualizations
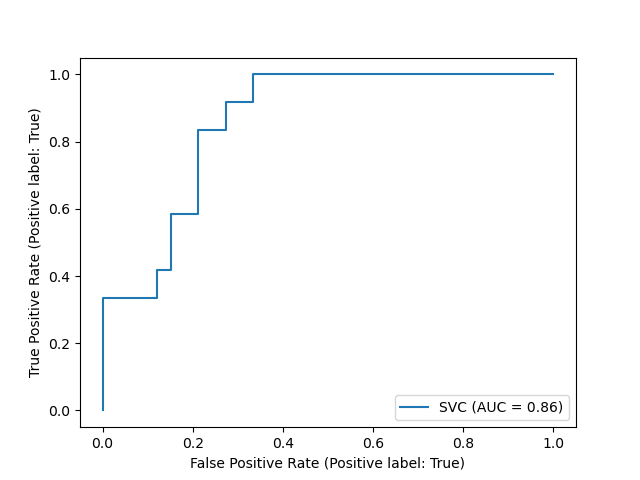
Scikit-learn defines a simple API for creating visualizations for machine learning. The key feature of this API is to allow for quick plotting and visual adjustments without recalculation. In the following example, we plot a ROC curve for a fitted support vector machine:
from sklearn.model_selection import train_test_split
from sklearn.svm import SVC
from sklearn.metrics import plot_roc_curve
from sklearn.datasets import load_wine

X_train, X_test, y_train, y_test = train_test_split(X, y, random_state=42)
svc = SVC(random_state=42)
svc.fit(X_train, y_train)

svc_disp = plot_roc_curve(svc, X_test, y_test)
The returned svc_disp object allows us to continue using the already computed
ROC curve for SVC in future plots. In this case, the svc_disp is a
RocCurveDisplay that stores the computed values as
attributes called roc_auc, fpr, and tpr. Next, we train a random forest
classifier and plot the previously computed roc curve again by using the plot
method of the Display object.
import matplotlib.pyplot as plt
from sklearn.ensemble import RandomForestClassifier

rfc = RandomForestClassifier(random_state=42)
rfc.fit(X_train, y_train)

ax = plt.gca()
rfc_disp = plot_roc_curve(rfc, X_test, y_test, ax=ax, alpha=0.8)
svc_disp.plot(ax=ax, alpha=0.8)
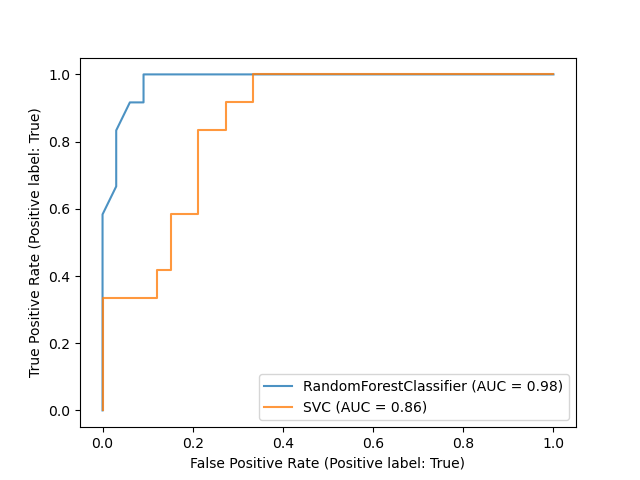
Notice that we pass alpha=0.8 to the plot functions to adjust the alpha
values of the curves.
Examples:
5.1. Available Plotting Utilities
5.1.1. Functions
Partial dependence (PD) and individual conditional expectation (ICE) plots. |
|
|
Plot Confusion Matrix. |
|
Plot detection error tradeoff (DET) curve. |
Plot Precision Recall Curve for binary classifiers. |
|
|
Plot Receiver operating characteristic (ROC) curve. |
5.1.2. Display Objects
Partial Dependence Plot (PDP). |
|
|
Confusion Matrix visualization. |
|
DET curve visualization. |
|
Precision Recall visualization. |
|
ROC Curve visualization. |