Note
Click here to download the full example code or to run this example in your browser via Binder
Release Highlights for scikit-learn 1.2
We are pleased to announce the release of scikit-learn 1.2! Many bug fixes and improvements were added, as well as some new key features. We detail below a few of the major features of this release. For an exhaustive list of all the changes, please refer to the release notes.
To install the latest version (with pip):
pip install --upgrade scikit-learn
or with conda:
conda install -c conda-forge scikit-learn
Pandas output with set_output API
scikit-learn’s transformers now support pandas output with the set_output API.
To learn more about the set_output API see the example:
Introducing the set_output API and
# this video, pandas DataFrame output for scikit-learn transformers
(some examples).
import numpy as np
from sklearn.datasets import load_iris
from sklearn.preprocessing import StandardScaler, KBinsDiscretizer
from sklearn.compose import ColumnTransformer

X, y = load_iris(as_frame=True, return_X_y=True)
sepal_cols = ["sepal length (cm)", "sepal width (cm)"]
petal_cols = ["petal length (cm)", "petal width (cm)"]

preprocessor = ColumnTransformer(
    [
        ("scaler", StandardScaler(), sepal_cols),
        ("kbin", KBinsDiscretizer(encode="ordinal"), petal_cols),
    ],
    verbose_feature_names_out=False,
).set_output(transform="pandas")

X_out = preprocessor.fit_transform(X)
X_out.sample(n=5, random_state=0)
Interaction constraints in Histogram-based Gradient Boosting Trees
HistGradientBoostingRegressor and
HistGradientBoostingClassifier now supports interaction constraints
with the interaction_cst parameter. For details, see the
User Guide. In the following example, features are not
allowed to interact.
from sklearn.datasets import load_diabetes
from sklearn.ensemble import HistGradientBoostingRegressor

X, y = load_diabetes(return_X_y=True, as_frame=True)

hist_no_interact = HistGradientBoostingRegressor(
    interaction_cst=[[i] for i in range(X.shape[1])], random_state=0
)
hist_no_interact.fit(X, y)
New and enhanced displays
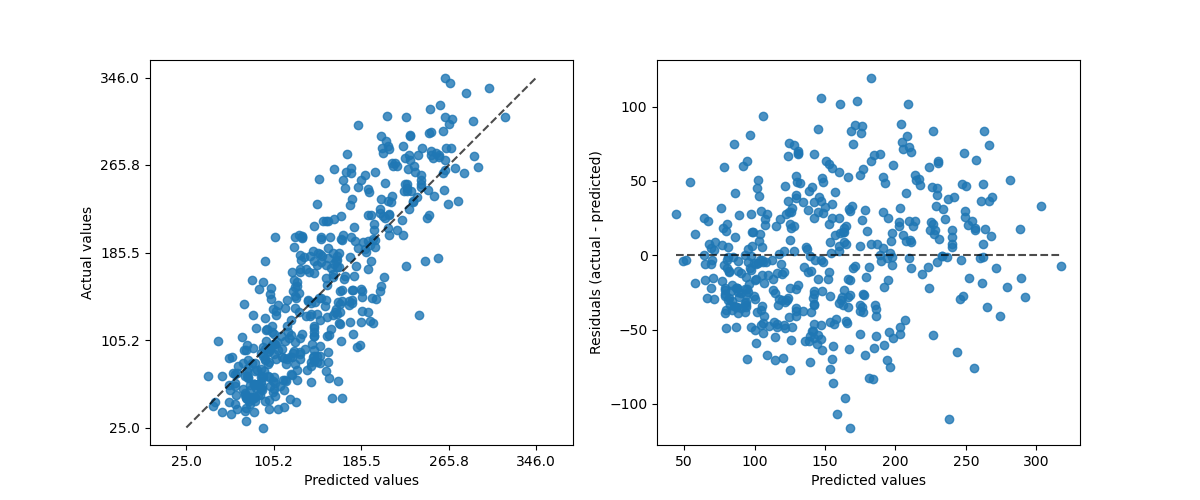
PredictionErrorDisplay provides a way to analyze regression
models in a qualitative manner.
import matplotlib.pyplot as plt
from sklearn.metrics import PredictionErrorDisplay

fig, axs = plt.subplots(nrows=1, ncols=2, figsize=(12, 5))
_ = PredictionErrorDisplay.from_estimator(
    hist_no_interact, X, y, kind="actual_vs_predicted", ax=axs[0]
)
_ = PredictionErrorDisplay.from_estimator(
    hist_no_interact, X, y, kind="residual_vs_predicted", ax=axs[1]
)
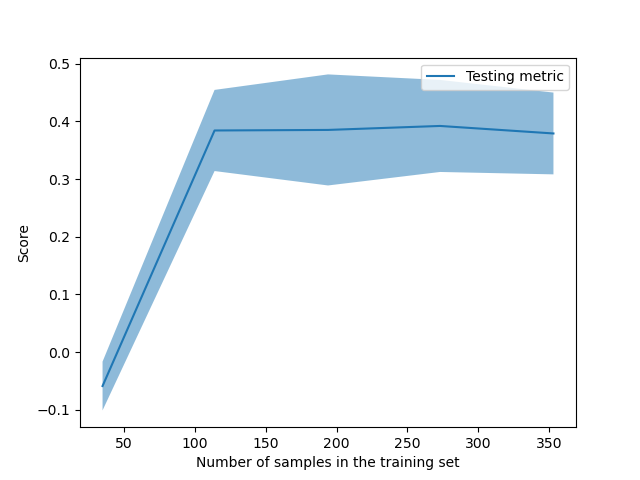
LearningCurveDisplay is now available to plot
results from learning_curve.
from sklearn.model_selection import LearningCurveDisplay

_ = LearningCurveDisplay.from_estimator(
    hist_no_interact, X, y, cv=5, n_jobs=2, train_sizes=np.linspace(0.1, 1, 5)
)
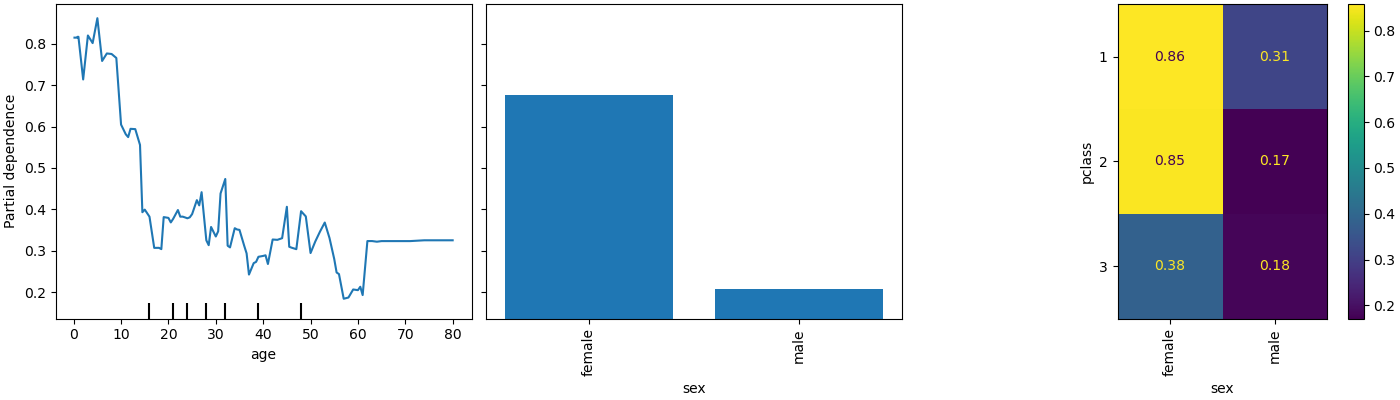
PartialDependenceDisplay exposes a new parameter
categorical_features to display partial dependence for categorical features
using bar plots and heatmaps.
from sklearn.datasets import fetch_openml

X, y = fetch_openml(
    "titanic", version=1, as_frame=True, return_X_y=True, parser="pandas"
)
X = X.select_dtypes(["number", "category"]).drop(columns=["body"])
from sklearn.preprocessing import OrdinalEncoder
from sklearn.pipeline import make_pipeline

categorical_features = ["pclass", "sex", "embarked"]
model = make_pipeline(
    ColumnTransformer(
        transformers=[("cat", OrdinalEncoder(), categorical_features)],
        remainder="passthrough",
    ),
    HistGradientBoostingRegressor(random_state=0),
).fit(X, y)
from sklearn.inspection import PartialDependenceDisplay

fig, ax = plt.subplots(figsize=(14, 4), constrained_layout=True)
_ = PartialDependenceDisplay.from_estimator(
    model,
    X,
    features=["age", "sex", ("pclass", "sex")],
    categorical_features=categorical_features,
    ax=ax,
)
Faster parser in fetch_openml
fetch_openml now supports a new "pandas" parser that is
more memory and CPU efficient. In v1.4, the default will change to
parser="auto" which will automatically use the "pandas" parser for dense
data and "liac-arff" for sparse data.
X, y = fetch_openml(
    "titanic", version=1, as_frame=True, return_X_y=True, parser="pandas"
)
X.head()
Experimental Array API support in LinearDiscriminantAnalysis
Experimental support for the Array API
specification was added to LinearDiscriminantAnalysis.
The estimator can now run on any Array API compliant libraries such as
CuPy, a GPU-accelerated array
library. For details, see the User Guide.
Improved efficiency of many estimators
In version 1.1 the efficiency of many estimators relying on the computation of pairwise distances (essentially estimators related to clustering, manifold learning and neighbors search algorithms) was greatly improved for float64 dense input. Efficiency improvement especially were a reduced memory footprint and a much better scalability on multi-core machines. In version 1.2, the efficiency of these estimators was further improved for all combinations of dense and sparse inputs on float32 and float64 datasets, except the sparse-dense and dense-sparse combinations for the Euclidean and Squared Euclidean Distance metrics. A detailed list of the impacted estimators can be found in the changelog.
Total running time of the script: ( 0 minutes 10.872 seconds)