sklearn.metrics.PredictionErrorDisplay
- class sklearn.metrics.PredictionErrorDisplay(*, y_true, y_pred)[source]
Visualization of the prediction error of a regression model.
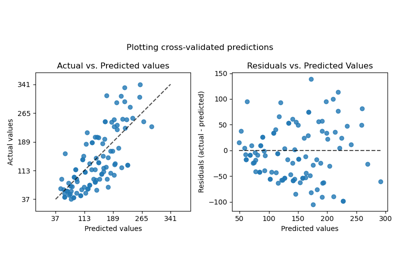
This tool can display “residuals vs predicted” or “actual vs predicted” using scatter plots to qualitatively assess the behavior of a regressor, preferably on held-out data points.
See the details in the docstrings of
from_estimatororfrom_predictionsto create a visualizer. All parameters are stored as attributes.For general information regarding
scikit-learnvisualization tools, read more in the Visualization Guide. For details regarding interpreting these plots, refer to the Model Evaluation Guide.New in version 1.2.
- Parameters:
- y_truendarray of shape (n_samples,)
True values.
- y_predndarray of shape (n_samples,)
Prediction values.
- Attributes:
- line_matplotlib Artist
Optimal line representing
y_true == y_pred. Therefore, it is a diagonal line forkind="predictions"and a horizontal line forkind="residuals".- errors_lines_matplotlib Artist or None
Residual lines. If
with_errors=False, then it is set toNone.- scatter_matplotlib Artist
Scatter data points.
- ax_matplotlib Axes
Axes with the different matplotlib axis.
- figure_matplotlib Figure
Figure containing the scatter and lines.
See also
PredictionErrorDisplay.from_estimatorPrediction error visualization given an estimator and some data.
PredictionErrorDisplay.from_predictionsPrediction error visualization given the true and predicted targets.
Examples
>>> import matplotlib.pyplot as plt
>>> from sklearn.datasets import load_diabetes
>>> from sklearn.linear_model import Ridge
>>> from sklearn.metrics import PredictionErrorDisplay
>>> X, y = load_diabetes(return_X_y=True)
>>> ridge = Ridge().fit(X, y)
>>> y_pred = ridge.predict(X)
>>> display = PredictionErrorDisplay(y_true=y, y_pred=y_pred)
>>> display.plot()
<...>
>>> plt.show()

Methods
from_estimator(estimator, X, y, *[, kind, ...])Plot the prediction error given a regressor and some data.
from_predictions(y_true, y_pred, *[, kind, ...])Plot the prediction error given the true and predicted targets.
plot([ax, kind, scatter_kwargs, line_kwargs])Plot visualization.
- classmethod from_estimator(estimator, X, y, *, kind='residual_vs_predicted', subsample=1000, random_state=None, ax=None, scatter_kwargs=None, line_kwargs=None)[source]
Plot the prediction error given a regressor and some data.
For general information regarding
scikit-learnvisualization tools, read more in the Visualization Guide. For details regarding interpreting these plots, refer to the Model Evaluation Guide.New in version 1.2.
- Parameters:
- estimatorestimator instance
Fitted regressor or a fitted
Pipelinein which the last estimator is a regressor.- X{array-like, sparse matrix} of shape (n_samples, n_features)
Input values.
- yarray-like of shape (n_samples,)
Target values.
- kind{“actual_vs_predicted”, “residual_vs_predicted”}, default=”residual_vs_predicted”
The type of plot to draw:
“actual_vs_predicted” draws the the observed values (y-axis) vs. the predicted values (x-axis).
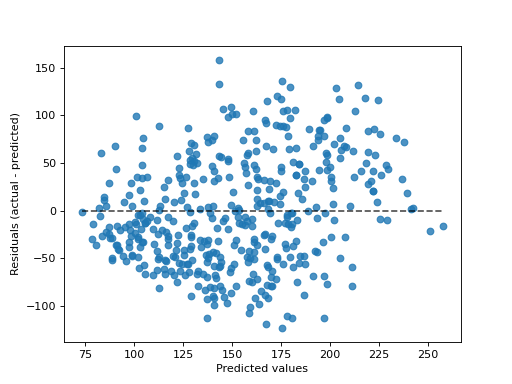
“residual_vs_predicted” draws the residuals, i.e difference between observed and predicted values, (y-axis) vs. the predicted values (x-axis).
- subsamplefloat, int or None, default=1_000
Sampling the samples to be shown on the scatter plot. If
float, it should be between 0 and 1 and represents the proportion of the original dataset. Ifint, it represents the number of samples display on the scatter plot. IfNone, no subsampling will be applied. by default, a 1000 samples or less will be displayed.- random_stateint or RandomState, default=None
Controls the randomness when
subsampleis notNone. See Glossary for details.- axmatplotlib axes, default=None
Axes object to plot on. If
None, a new figure and axes is created.- scatter_kwargsdict, default=None
Dictionary with keywords passed to the
matplotlib.pyplot.scattercall.- line_kwargsdict, default=None
Dictionary with keyword passed to the
matplotlib.pyplot.plotcall to draw the optimal line.
- Returns:
- display
PredictionErrorDisplay Object that stores the computed values.
- display
See also
PredictionErrorDisplayPrediction error visualization for regression.
PredictionErrorDisplay.from_predictionsPrediction error visualization given the true and predicted targets.
Examples
>>> import matplotlib.pyplot as plt
>>> from sklearn.datasets import load_diabetes
>>> from sklearn.linear_model import Ridge
>>> from sklearn.metrics import PredictionErrorDisplay
>>> X, y = load_diabetes(return_X_y=True)
>>> ridge = Ridge().fit(X, y)
>>> disp = PredictionErrorDisplay.from_estimator(ridge, X, y)
>>> plt.show()

- classmethod from_predictions(y_true, y_pred, *, kind='residual_vs_predicted', subsample=1000, random_state=None, ax=None, scatter_kwargs=None, line_kwargs=None)[source]
Plot the prediction error given the true and predicted targets.
For general information regarding
scikit-learnvisualization tools, read more in the Visualization Guide. For details regarding interpreting these plots, refer to the Model Evaluation Guide.New in version 1.2.
- Parameters:
- y_truearray-like of shape (n_samples,)
True target values.
- y_predarray-like of shape (n_samples,)
Predicted target values.
- kind{“actual_vs_predicted”, “residual_vs_predicted”}, default=”residual_vs_predicted”
The type of plot to draw:
“actual_vs_predicted” draws the the observed values (y-axis) vs. the predicted values (x-axis).
“residual_vs_predicted” draws the residuals, i.e difference between observed and predicted values, (y-axis) vs. the predicted values (x-axis).
- subsamplefloat, int or None, default=1_000
Sampling the samples to be shown on the scatter plot. If
float, it should be between 0 and 1 and represents the proportion of the original dataset. Ifint, it represents the number of samples display on the scatter plot. IfNone, no subsampling will be applied. by default, a 1000 samples or less will be displayed.- random_stateint or RandomState, default=None
Controls the randomness when
subsampleis notNone. See Glossary for details.- axmatplotlib axes, default=None
Axes object to plot on. If
None, a new figure and axes is created.- scatter_kwargsdict, default=None
Dictionary with keywords passed to the
matplotlib.pyplot.scattercall.- line_kwargsdict, default=None
Dictionary with keyword passed to the
matplotlib.pyplot.plotcall to draw the optimal line.
- Returns:
- display
PredictionErrorDisplay Object that stores the computed values.
- display
See also
PredictionErrorDisplayPrediction error visualization for regression.
PredictionErrorDisplay.from_estimatorPrediction error visualization given an estimator and some data.
Examples
>>> import matplotlib.pyplot as plt
>>> from sklearn.datasets import load_diabetes
>>> from sklearn.linear_model import Ridge
>>> from sklearn.metrics import PredictionErrorDisplay
>>> X, y = load_diabetes(return_X_y=True)
>>> ridge = Ridge().fit(X, y)
>>> y_pred = ridge.predict(X)
>>> disp = PredictionErrorDisplay.from_predictions(y_true=y, y_pred=y_pred)
>>> plt.show()
- plot(ax=None, *, kind='residual_vs_predicted', scatter_kwargs=None, line_kwargs=None)[source]
Plot visualization.
Extra keyword arguments will be passed to matplotlib’s
plot.- Parameters:
- axmatplotlib axes, default=None
Axes object to plot on. If
None, a new figure and axes is created.- kind{“actual_vs_predicted”, “residual_vs_predicted”}, default=”residual_vs_predicted”
The type of plot to draw:
“actual_vs_predicted” draws the the observed values (y-axis) vs. the predicted values (x-axis).
“residual_vs_predicted” draws the residuals, i.e difference between observed and predicted values, (y-axis) vs. the predicted values (x-axis).
- scatter_kwargsdict, default=None
Dictionary with keywords passed to the
matplotlib.pyplot.scattercall.- line_kwargsdict, default=None
Dictionary with keyword passed to the
matplotlib.pyplot.plotcall to draw the optimal line.
- Returns:
- display
PredictionErrorDisplay Object that stores computed values.
- display