sklearn.metrics.plot_precision_recall_curve
-
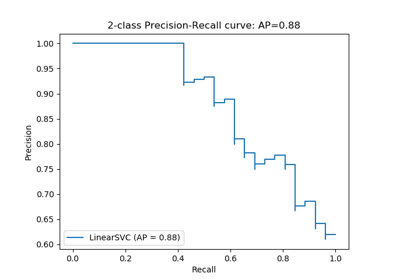
sklearn.metrics.plot_precision_recall_curve(estimator, X, y, sample_weight=None, response_method='auto', name=None, ax=None, **kwargs)[source]¶ Plot Precision Recall Curve for binary classifiers.
Extra keyword arguments will be passed to matplotlib’s
plot.Read more in the User Guide.
- Parameters
- estimatorestimator instance
Trained classifier.
- X{array-like, sparse matrix} of shape (n_samples, n_features)
Input values.
- yarray-like of shape (n_samples,)
Binary target values.
- sample_weightarray-like of shape (n_samples,), default=None
Sample weights.
- response_method{‘predict_proba’, ‘decision_function’, ‘auto’}, default=’auto’
Specifies whether to use predict_proba or decision_function as the target response. If set to ‘auto’, predict_proba is tried first and if it does not exist decision_function is tried next.
- namestr, default=None
Name for labeling curve. If
None, the name of the estimator is used.- axmatplotlib axes, default=None
Axes object to plot on. If
None, a new figure and axes is created.- **kwargsdict
Keyword arguments to be passed to matplotlib’s
plot.
- Returns
- display
PrecisionRecallDisplay Object that stores computed values.
- display