sklearn.metrics.plot_confusion_matrix
-
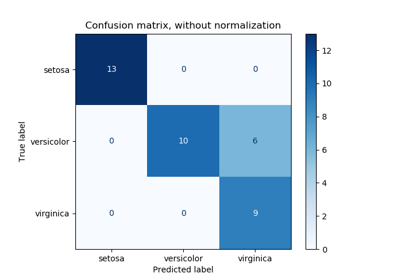
sklearn.metrics.plot_confusion_matrix(estimator, X, y_true, labels=None, sample_weight=None, normalize=None, display_labels=None, include_values=True, xticks_rotation='horizontal', values_format=None, cmap='viridis', ax=None)[source]¶ Plot Confusion Matrix.
Read more in the User Guide.
- Parameters
- estimatorestimator instance
Trained classifier.
- X{array-like, sparse matrix} of shape (n_samples, n_features)
Input values.
- yarray-like of shape (n_samples,)
Target values.
- labelsarray-like of shape (n_classes,), default=None
List of labels to index the matrix. This may be used to reorder or select a subset of labels. If
Noneis given, those that appear at least once iny_trueory_predare used in sorted order.- sample_weightarray-like of shape (n_samples,), default=None
Sample weights.
- normalize{‘true’, ‘pred’, ‘all’}, default=None
Normalizes confusion matrix over the true (rows), predicted (columns) conditions or all the population. If None, confusion matrix will not be normalized.
- display_labelsarray-like of shape (n_classes,), default=None
Target names used for plotting. By default,
labelswill be used if it is defined, otherwise the unique labels ofy_trueandy_predwill be used.- include_valuesbool, default=True
Includes values in confusion matrix.
- xticks_rotation{‘vertical’, ‘horizontal’} or float, default=’horizontal’
Rotation of xtick labels.
- values_formatstr, default=None
Format specification for values in confusion matrix. If
None, the format specification is ‘.2g’.- cmapstr or matplotlib Colormap, default=’viridis’
Colormap recognized by matplotlib.
- axmatplotlib Axes, default=None
Axes object to plot on. If
None, a new figure and axes is created.
- Returns
- display
ConfusionMatrixDisplay
- display