Note
Click here to download the full example code or to run this example in your browser via Binder
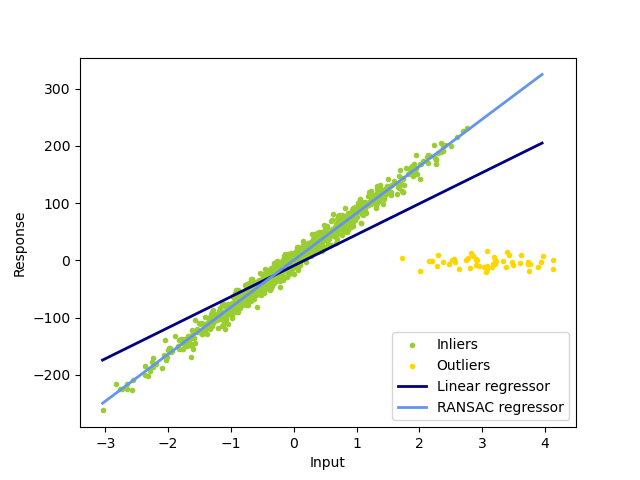
Robust linear model estimation using RANSAC
In this example we see how to robustly fit a linear model to faulty data using the RANSAC algorithm.
Out:
Estimated coefficients (true, linear regression, RANSAC):
82.1903908407869 [54.17236387] [82.08533159]
import numpy as np
from matplotlib import pyplot as plt

from sklearn import linear_model, datasets


n_samples = 1000
n_outliers = 50


X, y, coef = datasets.make_regression(
    n_samples=n_samples,
    n_features=1,
    n_informative=1,
    noise=10,
    coef=True,
    random_state=0,
)

# Add outlier data
np.random.seed(0)
X[:n_outliers] = 3 + 0.5 * np.random.normal(size=(n_outliers, 1))
y[:n_outliers] = -3 + 10 * np.random.normal(size=n_outliers)

# Fit line using all data
lr = linear_model.LinearRegression()
lr.fit(X, y)

# Robustly fit linear model with RANSAC algorithm
ransac = linear_model.RANSACRegressor()
ransac.fit(X, y)
inlier_mask = ransac.inlier_mask_
outlier_mask = np.logical_not(inlier_mask)

# Predict data of estimated models
line_X = np.arange(X.min(), X.max())[:, np.newaxis]
line_y = lr.predict(line_X)
line_y_ransac = ransac.predict(line_X)

# Compare estimated coefficients
print("Estimated coefficients (true, linear regression, RANSAC):")
print(coef, lr.coef_, ransac.estimator_.coef_)

lw = 2
plt.scatter(
    X[inlier_mask], y[inlier_mask], color="yellowgreen", marker=".", label="Inliers"
)
plt.scatter(
    X[outlier_mask], y[outlier_mask], color="gold", marker=".", label="Outliers"
)
plt.plot(line_X, line_y, color="navy", linewidth=lw, label="Linear regressor")
plt.plot(
    line_X,
    line_y_ransac,
    color="cornflowerblue",
    linewidth=lw,
    label="RANSAC regressor",
)
plt.legend(loc="lower right")
plt.xlabel("Input")
plt.ylabel("Response")
plt.show()
Total running time of the script: ( 0 minutes 0.085 seconds)