sklearn.metrics.precision_recall_curve
-
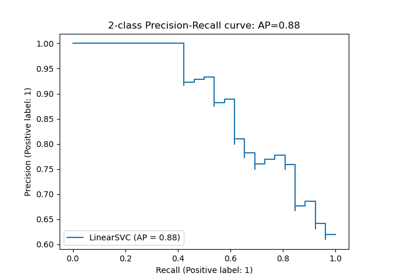
sklearn.metrics.precision_recall_curve(y_true, probas_pred, *, pos_label=None, sample_weight=None)[source]¶ Compute precision-recall pairs for different probability thresholds.
Note: this implementation is restricted to the binary classification task.
The precision is the ratio
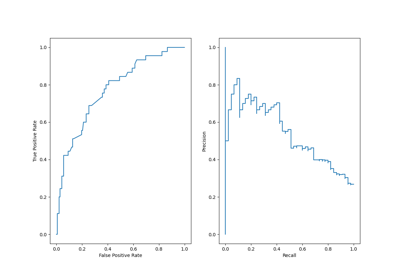
tp / (tp + fp)wheretpis the number of true positives andfpthe number of false positives. The precision is intuitively the ability of the classifier not to label as positive a sample that is negative.The recall is the ratio
tp / (tp + fn)wheretpis the number of true positives andfnthe number of false negatives. The recall is intuitively the ability of the classifier to find all the positive samples.The last precision and recall values are 1. and 0. respectively and do not have a corresponding threshold. This ensures that the graph starts on the y axis.
Read more in the User Guide.
- Parameters
- y_truendarray of shape (n_samples,)
True binary labels. If labels are not either {-1, 1} or {0, 1}, then pos_label should be explicitly given.
- probas_predndarray of shape (n_samples,)
Estimated probabilities or output of a decision function.
- pos_labelint or str, default=None
The label of the positive class. When
pos_label=None, if y_true is in {-1, 1} or {0, 1},pos_labelis set to 1, otherwise an error will be raised.- sample_weightarray-like of shape (n_samples,), default=None
Sample weights.
- Returns
- precisionndarray of shape (n_thresholds + 1,)
Precision values such that element i is the precision of predictions with score >= thresholds[i] and the last element is 1.
- recallndarray of shape (n_thresholds + 1,)
Decreasing recall values such that element i is the recall of predictions with score >= thresholds[i] and the last element is 0.
- thresholdsndarray of shape (n_thresholds,)
Increasing thresholds on the decision function used to compute precision and recall. n_thresholds <= len(np.unique(probas_pred)).
See also
plot_precision_recall_curvePlot Precision Recall Curve for binary classifiers.
PrecisionRecallDisplayPrecision Recall visualization.
average_precision_scoreCompute average precision from prediction scores.
det_curveCompute error rates for different probability thresholds.
roc_curveCompute Receiver operating characteristic (ROC) curve.
Examples
>>> import numpy as np
>>> from sklearn.metrics import precision_recall_curve
>>> y_true = np.array([0, 0, 1, 1])
>>> y_scores = np.array([0.1, 0.4, 0.35, 0.8])
>>> precision, recall, thresholds = precision_recall_curve(
...     y_true, y_scores)
>>> precision
array([0.66666667, 0.5       , 1.        , 1.        ])
>>> recall
array([1. , 0.5, 0.5, 0. ])
>>> thresholds
array([0.35, 0.4 , 0.8 ])