Note
Click here to download the full example code or to run this example in your browser via Binder
Plot individual and voting regression predictions
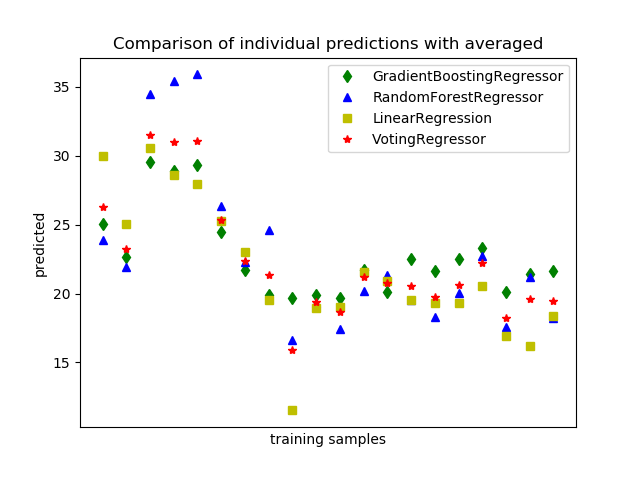
Plot individual and averaged regression predictions for Boston dataset.
First, three exemplary regressors are initialized
(GradientBoostingRegressor,
RandomForestRegressor, and
LinearRegression) and used to initialize a
VotingRegressor.
The red starred dots are the averaged predictions.

print(__doc__)

import matplotlib.pyplot as plt

from sklearn import datasets
from sklearn.ensemble import GradientBoostingRegressor
from sklearn.ensemble import RandomForestRegressor
from sklearn.linear_model import LinearRegression
from sklearn.ensemble import VotingRegressor

# Loading some example data
X, y = datasets.load_boston(return_X_y=True)

# Training classifiers
reg1 = GradientBoostingRegressor(random_state=1, n_estimators=10)
reg2 = RandomForestRegressor(random_state=1, n_estimators=10)
reg3 = LinearRegression()
ereg = VotingRegressor([('gb', reg1), ('rf', reg2), ('lr', reg3)])
reg1.fit(X, y)
reg2.fit(X, y)
reg3.fit(X, y)
ereg.fit(X, y)

xt = X[:20]

plt.figure()
plt.plot(reg1.predict(xt), 'gd', label='GradientBoostingRegressor')
plt.plot(reg2.predict(xt), 'b^', label='RandomForestRegressor')
plt.plot(reg3.predict(xt), 'ys', label='LinearRegression')
plt.plot(ereg.predict(xt), 'r*', label='VotingRegressor')
plt.tick_params(axis='x', which='both', bottom=False, top=False,
                labelbottom=False)
plt.ylabel('predicted')
plt.xlabel('training samples')
plt.legend(loc="best")
plt.title('Comparison of individual predictions with averaged')
plt.show()
Total running time of the script: ( 0 minutes 0.461 seconds)
Estimated memory usage: 8 MB
