Note
Click here to download the full example code or to run this example in your browser via Binder
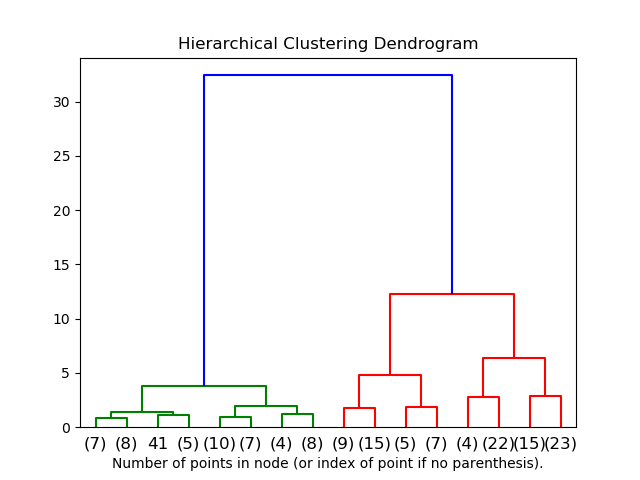
Plot Hierarchical Clustering Dendrogram
This example plots the corresponding dendrogram of a hierarchical clustering using AgglomerativeClustering and the dendrogram method available in scipy.
import numpy as np

from matplotlib import pyplot as plt
from scipy.cluster.hierarchy import dendrogram
from sklearn.datasets import load_iris
from sklearn.cluster import AgglomerativeClustering


def plot_dendrogram(model, **kwargs):
    # Create linkage matrix and then plot the dendrogram

    # create the counts of samples under each node
    counts = np.zeros(model.children_.shape[0])
    n_samples = len(model.labels_)
    for i, merge in enumerate(model.children_):
        current_count = 0
        for child_idx in merge:
            if child_idx < n_samples:
                current_count += 1  # leaf node
            else:
                current_count += counts[child_idx - n_samples]
        counts[i] = current_count

    linkage_matrix = np.column_stack([model.children_, model.distances_,
                                      counts]).astype(float)

    # Plot the corresponding dendrogram
    dendrogram(linkage_matrix, **kwargs)


iris = load_iris()
X = iris.data

# setting distance_threshold=0 ensures we compute the full tree.
model = AgglomerativeClustering(distance_threshold=0, n_clusters=None)

model = model.fit(X)
plt.title('Hierarchical Clustering Dendrogram')
# plot the top three levels of the dendrogram
plot_dendrogram(model, truncate_mode='level', p=3)
plt.xlabel("Number of points in node (or index of point if no parenthesis).")
plt.show()
Total running time of the script: ( 0 minutes 0.324 seconds)
Estimated memory usage: 9 MB