Note
Click here to download the full example code or to run this example in your browser via Binder
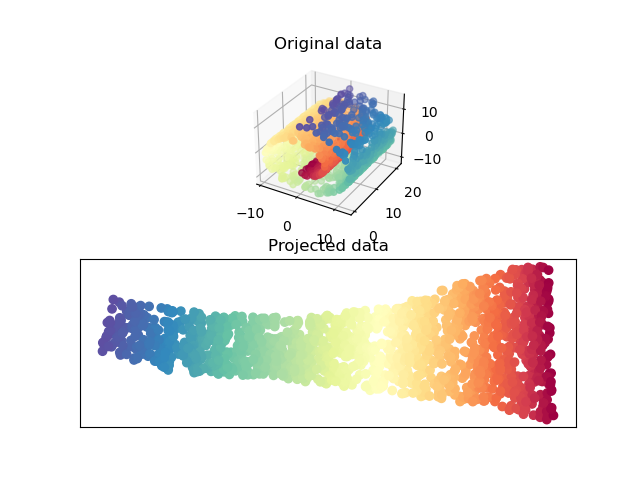
Swiss Roll reduction with LLE
An illustration of Swiss Roll reduction with locally linear embedding
Out:
Computing LLE embedding
Done. Reconstruction error: 9.47066e-08
# Author: Fabian Pedregosa -- <fabian.pedregosa@inria.fr>
# License: BSD 3 clause (C) INRIA 2011

import matplotlib.pyplot as plt

# This import is needed to modify the way figure behaves
from mpl_toolkits.mplot3d import Axes3D

Axes3D

# ----------------------------------------------------------------------
# Locally linear embedding of the swiss roll

from sklearn import manifold, datasets

X, color = datasets.make_swiss_roll(n_samples=1500)

print("Computing LLE embedding")
X_r, err = manifold.locally_linear_embedding(X, n_neighbors=12, n_components=2)
print("Done. Reconstruction error: %g" % err)

# ----------------------------------------------------------------------
# Plot result

fig = plt.figure()

ax = fig.add_subplot(211, projection="3d")
ax.scatter(X[:, 0], X[:, 1], X[:, 2], c=color, cmap=plt.cm.Spectral)

ax.set_title("Original data")
ax = fig.add_subplot(212)
ax.scatter(X_r[:, 0], X_r[:, 1], c=color, cmap=plt.cm.Spectral)
plt.axis("tight")
plt.xticks([]), plt.yticks([])
plt.title("Projected data")
plt.show()
Total running time of the script: ( 0 minutes 0.261 seconds)