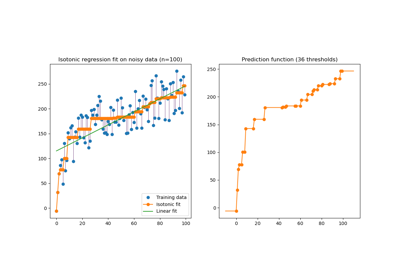
sklearn.isotonic.IsotonicRegression
-
class
sklearn.isotonic.IsotonicRegression(*, y_min=None, y_max=None, increasing=True, out_of_bounds='nan')[source]¶ Isotonic regression model.
Read more in the User Guide.
New in version 0.13.
- Parameters
- y_minfloat, default=None
Lower bound on the lowest predicted value (the minimum value may still be higher). If not set, defaults to -inf.
- y_maxfloat, default=None
Upper bound on the highest predicted value (the maximum may still be lower). If not set, defaults to +inf.
- increasingbool or ‘auto’, default=True
Determines whether the predictions should be constrained to increase or decrease with
X. ‘auto’ will decide based on the Spearman correlation estimate’s sign.- out_of_bounds{‘nan’, ‘clip’, ‘raise’}, default=’nan’
Handles how
Xvalues outside of the training domain are handled during prediction.‘nan’, predictions will be NaN.
‘clip’, predictions will be set to the value corresponding to the nearest train interval endpoint.
‘raise’, a
ValueErroris raised.
- Attributes
- X_min_float
Minimum value of input array
X_for left bound.- X_max_float
Maximum value of input array
X_for right bound.- X_thresholds_ndarray of shape (n_thresholds,)
Unique ascending
Xvalues used to interpolate the y = f(X) monotonic function.New in version 0.24.
- y_thresholds_ndarray of shape (n_thresholds,)
De-duplicated
yvalues suitable to interpolate the y = f(X) monotonic function.New in version 0.24.
- f_function
The stepwise interpolating function that covers the input domain
X.- increasing_bool
Inferred value for
increasing.
Notes
Ties are broken using the secondary method from de Leeuw, 1977.
References
Isotonic Median Regression: A Linear Programming Approach Nilotpal Chakravarti Mathematics of Operations Research Vol. 14, No. 2 (May, 1989), pp. 303-308
Isotone Optimization in R : Pool-Adjacent-Violators Algorithm (PAVA) and Active Set Methods de Leeuw, Hornik, Mair Journal of Statistical Software 2009
Correctness of Kruskal’s algorithms for monotone regression with ties de Leeuw, Psychometrica, 1977
Examples
>>> from sklearn.datasets import make_regression
>>> from sklearn.isotonic import IsotonicRegression
>>> X, y = make_regression(n_samples=10, n_features=1, random_state=41)
>>> iso_reg = IsotonicRegression().fit(X, y)
>>> iso_reg.predict([.1, .2])
array([1.8628..., 3.7256...])
Methods
fit(X, y[, sample_weight])Fit the model using X, y as training data.
fit_transform(X[, y])Fit to data, then transform it.
get_params([deep])Get parameters for this estimator.
predict(T)Predict new data by linear interpolation.
score(X, y[, sample_weight])Return the coefficient of determination \(R^2\) of the prediction.
set_params(**params)Set the parameters of this estimator.
transform(T)Transform new data by linear interpolation
-
fit(X, y, sample_weight=None)[source]¶ Fit the model using X, y as training data.
- Parameters
- Xarray-like of shape (n_samples,) or (n_samples, 1)
Training data.
Changed in version 0.24: Also accepts 2d array with 1 feature.
- yarray-like of shape (n_samples,)
Training target.
- sample_weightarray-like of shape (n_samples,), default=None
Weights. If set to None, all weights will be set to 1 (equal weights).
- Returns
- selfobject
Returns an instance of self.
Notes
X is stored for future use, as
transformneeds X to interpolate new input data.
-
fit_transform(X, y=None, **fit_params)[source]¶ Fit to data, then transform it.
Fits transformer to
Xandywith optional parametersfit_paramsand returns a transformed version ofX.- Parameters
- Xarray-like of shape (n_samples, n_features)
Input samples.
- yarray-like of shape (n_samples,) or (n_samples, n_outputs), default=None
Target values (None for unsupervised transformations).
- **fit_paramsdict
Additional fit parameters.
- Returns
- X_newndarray array of shape (n_samples, n_features_new)
Transformed array.
-
get_params(deep=True)[source]¶ Get parameters for this estimator.
- Parameters
- deepbool, default=True
If True, will return the parameters for this estimator and contained subobjects that are estimators.
- Returns
- paramsdict
Parameter names mapped to their values.
-
predict(T)[source]¶ Predict new data by linear interpolation.
- Parameters
- Tarray-like of shape (n_samples,) or (n_samples, 1)
Data to transform.
- Returns
- y_predndarray of shape (n_samples,)
Transformed data.
-
score(X, y, sample_weight=None)[source]¶ Return the coefficient of determination \(R^2\) of the prediction.
The coefficient \(R^2\) is defined as \((1 - \frac{u}{v})\), where \(u\) is the residual sum of squares
((y_true - y_pred)
** 2).sum()
and \(v\) is the total sum of squares((y_true - y_true.mean()) ** 2).sum(). The best possible score is 1.0 and it can be negative (because the model can be arbitrarily worse). A constant model that always predicts the expected value ofy, disregarding the input features, would get a \(R^2\) score of 0.0.- Parameters
- Xarray-like of shape (n_samples, n_features)
Test samples. For some estimators this may be a precomputed kernel matrix or a list of generic objects instead with shape
(n_samples, n_samples_fitted), wheren_samples_fittedis the number of samples used in the fitting for the estimator.- yarray-like of shape (n_samples,) or (n_samples, n_outputs)
True values for
X.- sample_weightarray-like of shape (n_samples,), default=None
Sample weights.
- Returns
- scorefloat
\(R^2\) of
self.predict(X)wrt.y.
Notes
The \(R^2\) score used when calling
scoreon a regressor usesmultioutput='uniform_average'from version 0.23 to keep consistent with default value ofr2_score. This influences thescoremethod of all the multioutput regressors (except forMultiOutputRegressor).
-
set_params(**params)[source]¶ Set the parameters of this estimator.
The method works on simple estimators as well as on nested objects (such as
Pipeline). The latter have parameters of the form<component>__<parameter>so that it’s possible to update each component of a nested object.- Parameters
- **paramsdict
Estimator parameters.
- Returns
- selfestimator instance
Estimator instance.

