Note
Click here to download the full example code or to run this example in your browser via Binder
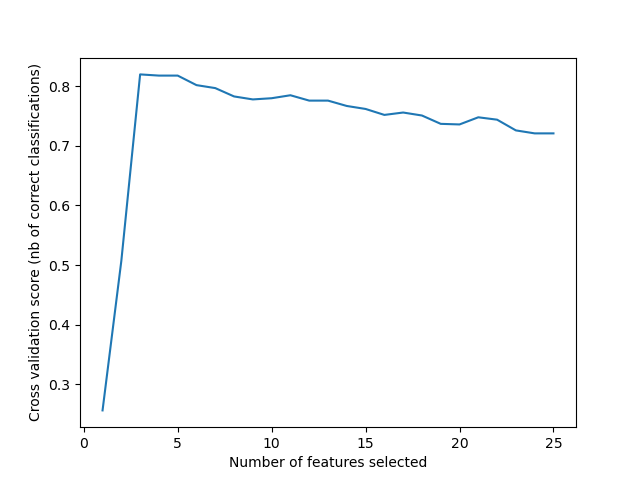
Recursive feature elimination with cross-validation
A recursive feature elimination example with automatic tuning of the number of features selected with cross-validation.
Out:
Optimal number of features : 3
print(__doc__)

import matplotlib.pyplot as plt
from sklearn.svm import SVC
from sklearn.model_selection import StratifiedKFold
from sklearn.feature_selection import RFECV
from sklearn.datasets import make_classification

# Build a classification task using 3 informative features
X, y = make_classification(n_samples=1000, n_features=25, n_informative=3,
                           n_redundant=2, n_repeated=0, n_classes=8,
                           n_clusters_per_class=1, random_state=0)

# Create the RFE object and compute a cross-validated score.
svc = SVC(kernel="linear")
# The "accuracy" scoring is proportional to the number of correct
# classifications

min_features_to_select = 1  # Minimum number of features to consider
rfecv = RFECV(estimator=svc, step=1, cv=StratifiedKFold(2),
              scoring='accuracy',
              min_features_to_select=min_features_to_select)
rfecv.fit(X, y)

print("Optimal number of features : %d" % rfecv.n_features_)

# Plot number of features VS. cross-validation scores
plt.figure()
plt.xlabel("Number of features selected")
plt.ylabel("Cross validation score (nb of correct classifications)")
plt.plot(range(min_features_to_select,
               len(rfecv.grid_scores_) + min_features_to_select),
         rfecv.grid_scores_)
plt.show()
Total running time of the script: ( 0 minutes 3.016 seconds)