Note
Click here to download the full example code or to run this example in your browser via Binder
Test with permutations the significance of a classification score
This example demonstrates the use of
permutation_test_score to evaluate the
significance of a cross-valdiated score using permutations.
# Authors:  Alexandre Gramfort <alexandre.gramfort@inria.fr>
#           Lucy Liu
# License: BSD 3 clause
#
# Dataset
# -------
#
# We will use the :ref:`iris_dataset`, which consists of measurements taken
# from 3 types of irises.

from sklearn.datasets import load_iris

iris = load_iris()
X = iris.data
y = iris.target
We will also generate some random feature data (i.e., 2200 features), uncorrelated with the class labels in the iris dataset.
import numpy as np

n_uncorrelated_features = 2200
rng = np.random.RandomState(seed=0)
# Use same number of samples as in iris and 2200 features
X_rand = rng.normal(size=(X.shape[0], n_uncorrelated_features))
Permutation test score
Next, we calculate the
permutation_test_score using the original
iris dataset, which strongly predict the labels and
the randomly generated features and iris labels, which should have
no dependency between features and labels. We use the
SVC classifier and Accuracy score to evaluate
the model at each round.
permutation_test_score generates a null
distribution by calculating the accuracy of the classifier
on 1000 different permutations of the dataset, where features
remain the same but labels undergo different permutations. This is the
distribution for the null hypothesis which states there is no dependency
between the features and labels. An empirical p-value is then calculated as
the percentage of permutations for which the score obtained is greater
that the score obtained using the original data.
from sklearn.svm import SVC
from sklearn.model_selection import StratifiedKFold
from sklearn.model_selection import permutation_test_score

clf = SVC(kernel='linear', random_state=7)
cv = StratifiedKFold(2, shuffle=True, random_state=0)

score_iris, perm_scores_iris, pvalue_iris = permutation_test_score(
    clf, X, y, scoring="accuracy", cv=cv, n_permutations=1000)

score_rand, perm_scores_rand, pvalue_rand = permutation_test_score(
    clf, X_rand, y, scoring="accuracy", cv=cv, n_permutations=1000)
Original data
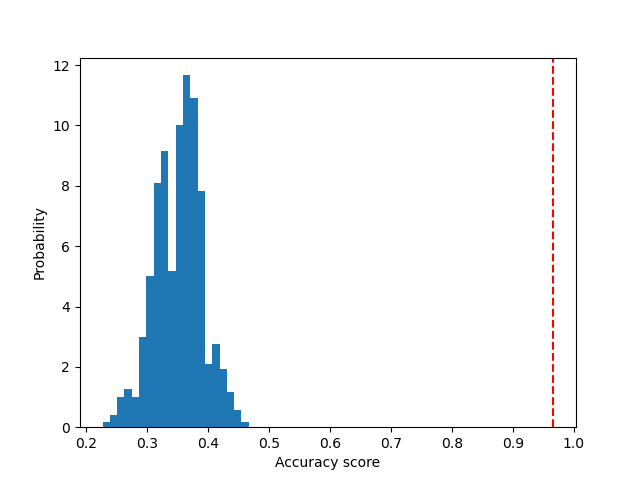
Below we plot a histogram of the permutation scores (the null distribution). The red line indicates the score obtained by the classifier on the original data. The score is much better than those obtained by using permuted data and the p-value is thus very low. This indicates that there is a low likelihood that this good score would be obtained by chance alone. It provides evidence that the iris dataset contains real dependency between features and labels and the classifier was able to utilize this to obtain good results.
import matplotlib.pyplot as plt

fig, ax = plt.subplots()

ax.hist(perm_scores_iris, bins=20, density=True)
ax.axvline(score_iris, ls='--', color='r')
score_label = (f"Score on original\ndata: {score_iris:.2f}\n"
               f"(p-value: {pvalue_iris:.3f})")
ax.text(0.7, 260, score_label, fontsize=12)
ax.set_xlabel("Accuracy score")
_ = ax.set_ylabel("Probability")
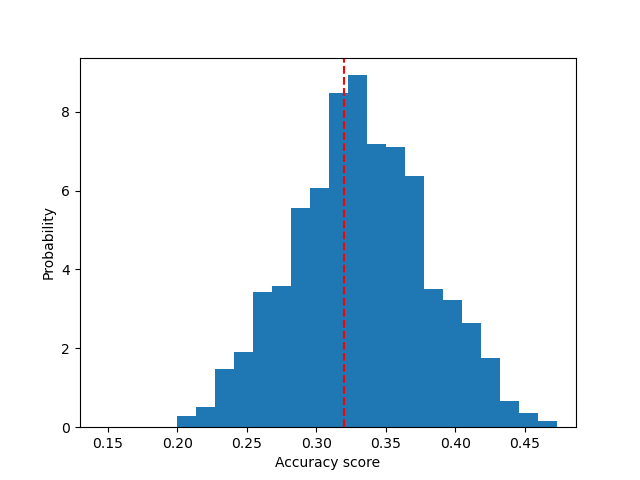
Random data
Below we plot the null distribution for the randomized data. The permutation scores are similar to those obtained using the original iris dataset because the permutation always destroys any feature label dependency present. The score obtained on the original randomized data in this case though, is very poor. This results in a large p-value, confirming that there was no feature label dependency in the original data.
fig, ax = plt.subplots()

ax.hist(perm_scores_rand, bins=20, density=True)
ax.set_xlim(0.13)
ax.axvline(score_rand, ls='--', color='r')
score_label = (f"Score on original\ndata: {score_rand:.2f}\n"
               f"(p-value: {pvalue_rand:.3f})")
ax.text(0.14, 125, score_label, fontsize=12)
ax.set_xlabel("Accuracy score")
ax.set_ylabel("Probability")
plt.show()
Another possible reason for obtaining a high p-value is that the classifier was not able to use the structure in the data. In this case, the p-value would only be low for classifiers that are able to utilize the dependency present. In our case above, where the data is random, all classifiers would have a high p-value as there is no structure present in the data.
Finally, note that this test has been shown to produce low p-values even if there is only weak structure in the data 1.
References:
- 1
Ojala and Garriga. Permutation Tests for Studying Classifier Performance. The Journal of Machine Learning Research (2010) vol. 11
Total running time of the script: ( 0 minutes 32.488 seconds)