Note
Click here to download the full example code or to run this example in your browser via Binder
Plot individual and voting regression predictions
A voting regressor is an ensemble meta-estimator that fits several base
regressors, each on the whole dataset. Then it averages the individual
predictions to form a final prediction.
We will use three different regressors to predict the data:
GradientBoostingRegressor,
RandomForestRegressor, and
LinearRegression).
Then the above 3 regressors will be used for the
VotingRegressor.
Finally, we will plot the predictions made by all models for comparison.
We will work with the diabetes dataset which consists of 10 features collected from a cohort of diabetes patients. The target is a quantitative measure of disease progression one year after baseline.
print(__doc__)

import matplotlib.pyplot as plt

from sklearn.datasets import load_diabetes
from sklearn.ensemble import GradientBoostingRegressor
from sklearn.ensemble import RandomForestRegressor
from sklearn.linear_model import LinearRegression
from sklearn.ensemble import VotingRegressor
Training classifiers
First, we will load the diabetes dataset and initiate a gradient boosting regressor, a random forest regressor and a linear regression. Next, we will use the 3 regressors to build the voting regressor:
X, y = load_diabetes(return_X_y=True)

# Train classifiers
reg1 = GradientBoostingRegressor(random_state=1)
reg2 = RandomForestRegressor(random_state=1)
reg3 = LinearRegression()

reg1.fit(X, y)
reg2.fit(X, y)
reg3.fit(X, y)

ereg = VotingRegressor([('gb', reg1), ('rf', reg2), ('lr', reg3)])
ereg.fit(X, y)
Making predictions
Now we will use each of the regressors to make the 20 first predictions.
xt = X[:20]

pred1 = reg1.predict(xt)
pred2 = reg2.predict(xt)
pred3 = reg3.predict(xt)
pred4 = ereg.predict(xt)
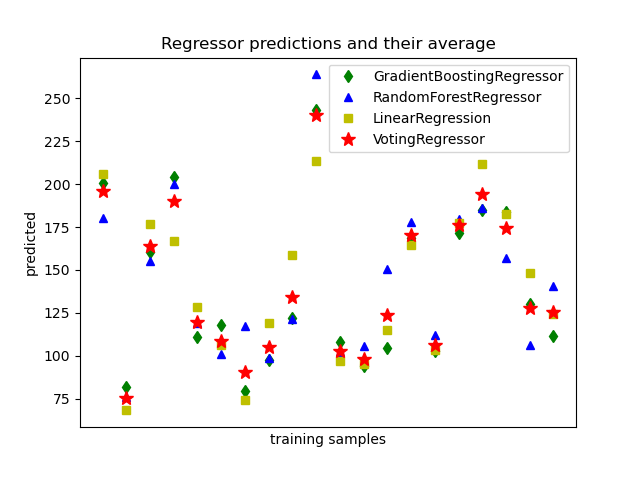
Plot the results
Finally, we will visualize the 20 predictions. The red stars show the average
prediction made by VotingRegressor.
plt.figure()
plt.plot(pred1, 'gd', label='GradientBoostingRegressor')
plt.plot(pred2, 'b^', label='RandomForestRegressor')
plt.plot(pred3, 'ys', label='LinearRegression')
plt.plot(pred4, 'r*', ms=10, label='VotingRegressor')

plt.tick_params(axis='x', which='both', bottom=False, top=False,
                labelbottom=False)
plt.ylabel('predicted')
plt.xlabel('training samples')
plt.legend(loc="best")
plt.title('Regressor predictions and their average')

plt.show()
Total running time of the script: ( 0 minutes 0.986 seconds)