sklearn.calibration.calibration_curve
-
sklearn.calibration.calibration_curve(y_true, y_prob, normalize=False, n_bins=5, strategy='uniform')[source]¶ Compute true and predicted probabilities for a calibration curve.
The method assumes the inputs come from a binary classifier.
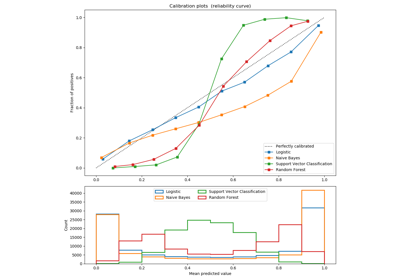
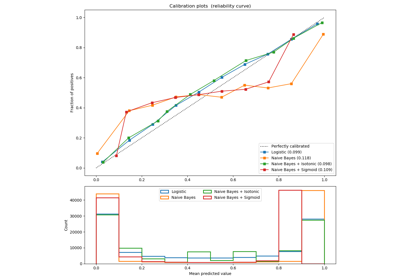
Calibration curves may also be referred to as reliability diagrams.
Read more in the User Guide.
- Parameters
- y_truearray, shape (n_samples,)
True targets.
- y_probarray, shape (n_samples,)
Probabilities of the positive class.
- normalizebool, optional, default=False
Whether y_prob needs to be normalized into the bin [0, 1], i.e. is not a proper probability. If True, the smallest value in y_prob is mapped onto 0 and the largest one onto 1.
- n_binsint
Number of bins. A bigger number requires more data. Bins with no data points (i.e. without corresponding values in y_prob) will not be returned, thus there may be fewer than n_bins in the return value.
- strategy{‘uniform’, ‘quantile’}, (default=’uniform’)
Strategy used to define the widths of the bins.
- uniform
All bins have identical widths.
- quantile
All bins have the same number of points.
- Returns
- prob_truearray, shape (n_bins,) or smaller
The true probability in each bin (fraction of positives).
- prob_predarray, shape (n_bins,) or smaller
The mean predicted probability in each bin.
References
Alexandru Niculescu-Mizil and Rich Caruana (2005) Predicting Good Probabilities With Supervised Learning, in Proceedings of the 22nd International Conference on Machine Learning (ICML). See section 4 (Qualitative Analysis of Predictions).


